
This Time Is Different!
THE SPRING PROMO IS HERE- We’re offering $300 off of the annual Portfolio Manager earlier than usual in March as we wrap up the 1st quarter of 2025 and celebrate the release of major updates last week! We now have overlayed chart indicators and several backtested algos complete with notifications and we anticipate more near-term improvements. Your needs are our focus, and we want the platform to become indispensable for your trading! Enter code SPRING2025 at checkout to take advantage of this limited time offering.
Alright, NEVER say “This time is different!” But let me make the case (if I didn’t jinx it) for a larger rebound being closer. Also, for some big picture context, 2 of the last 4 trading sessions did end up being positive days, and most indices were essentially flat since Tuesday, with DIA actually closing positive over the same timeframe. IWM in particular gave us a signal not seen since February 18, but we’ll make you wait to look more closely at that (NO SKIPPING AHEAD). Tonight’s YouTube video (which can be viewed by clicking here) covers our view of SPX in depth, including discussion of the 5500 level and the GEX we’re seeing at that area. We also go over BTC, NVDA, PLTR, and more, so check it out!
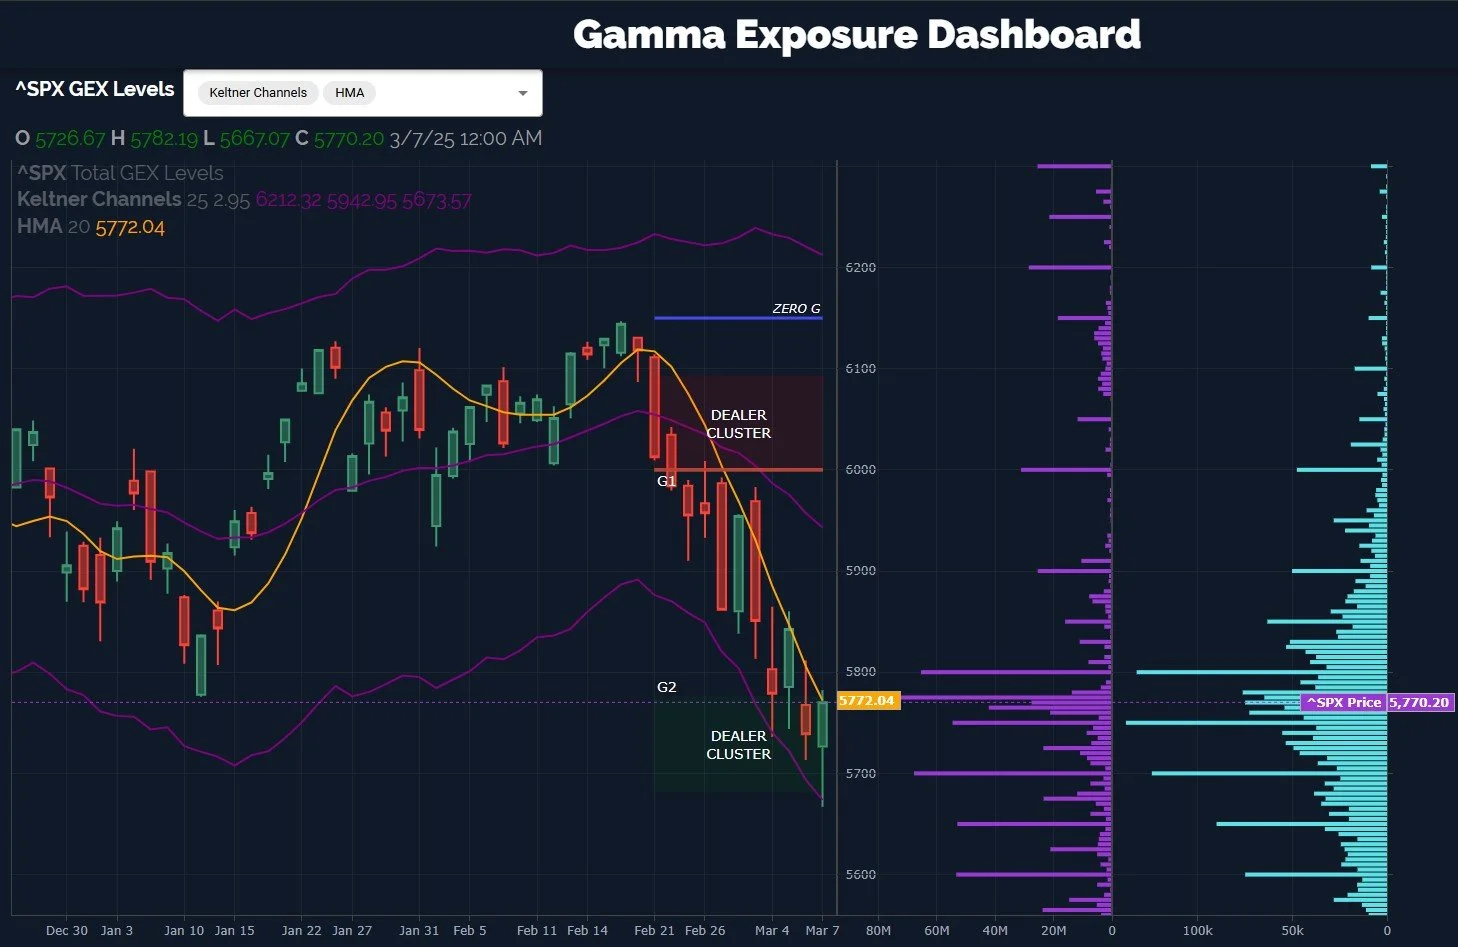
SPX once again touched the lower Keltner channel Friday, but impressively, bulls were able to turn the tables, rallying right into the declining Hull moving average. Closing right at 5770 puts SPX essentially at the line, a place we’ve visited every one of the last 7 trading sessions, closing at the line 3 of those sessions. Bulls might have rather seen price close decisively above that line, but it’s not surprising to see progress halt at that line, given the trend and given recent rejections. From a loosely defined maximum pain philosophy, I wouldn’t be surprised to see the next move be a gap above or below the line, otherwise it’s too easy for day traders to join in the party for the more complete move, right? I recall recent major bottoms involving a few gaps off of the lows. We definitely need to see SPX holding above the yellow line to grow some conviction that the rally has legs, and that the large GEX at 5800 can be overcome.
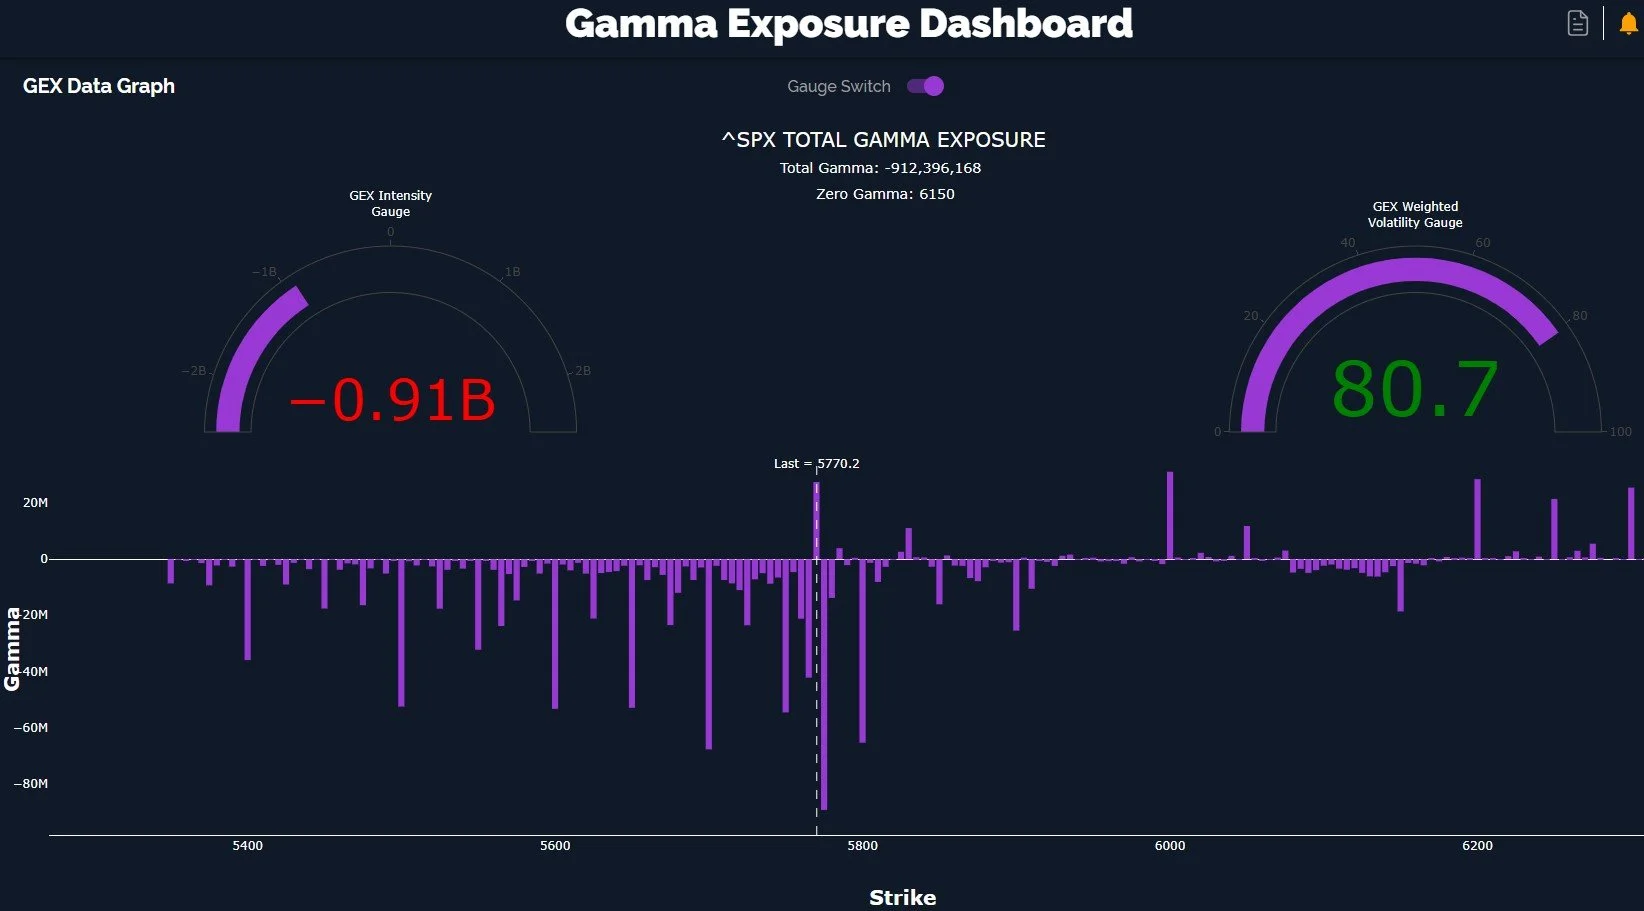
Looking at the gamma exposure (GEX) Graph above, we see SPX maintaining negative GEX that is close to what we would consider strongly negative at close to -1B. 5750 and 5700 are the next big spots to watch if additional attempts are made to push lower again, and the upside picture is fairly open until 6000 at this moment, at least once 5800 is conquered. It’s likely that GEX will shift once we breach 5800, but for now, 6000 as an upside target appears realistic.
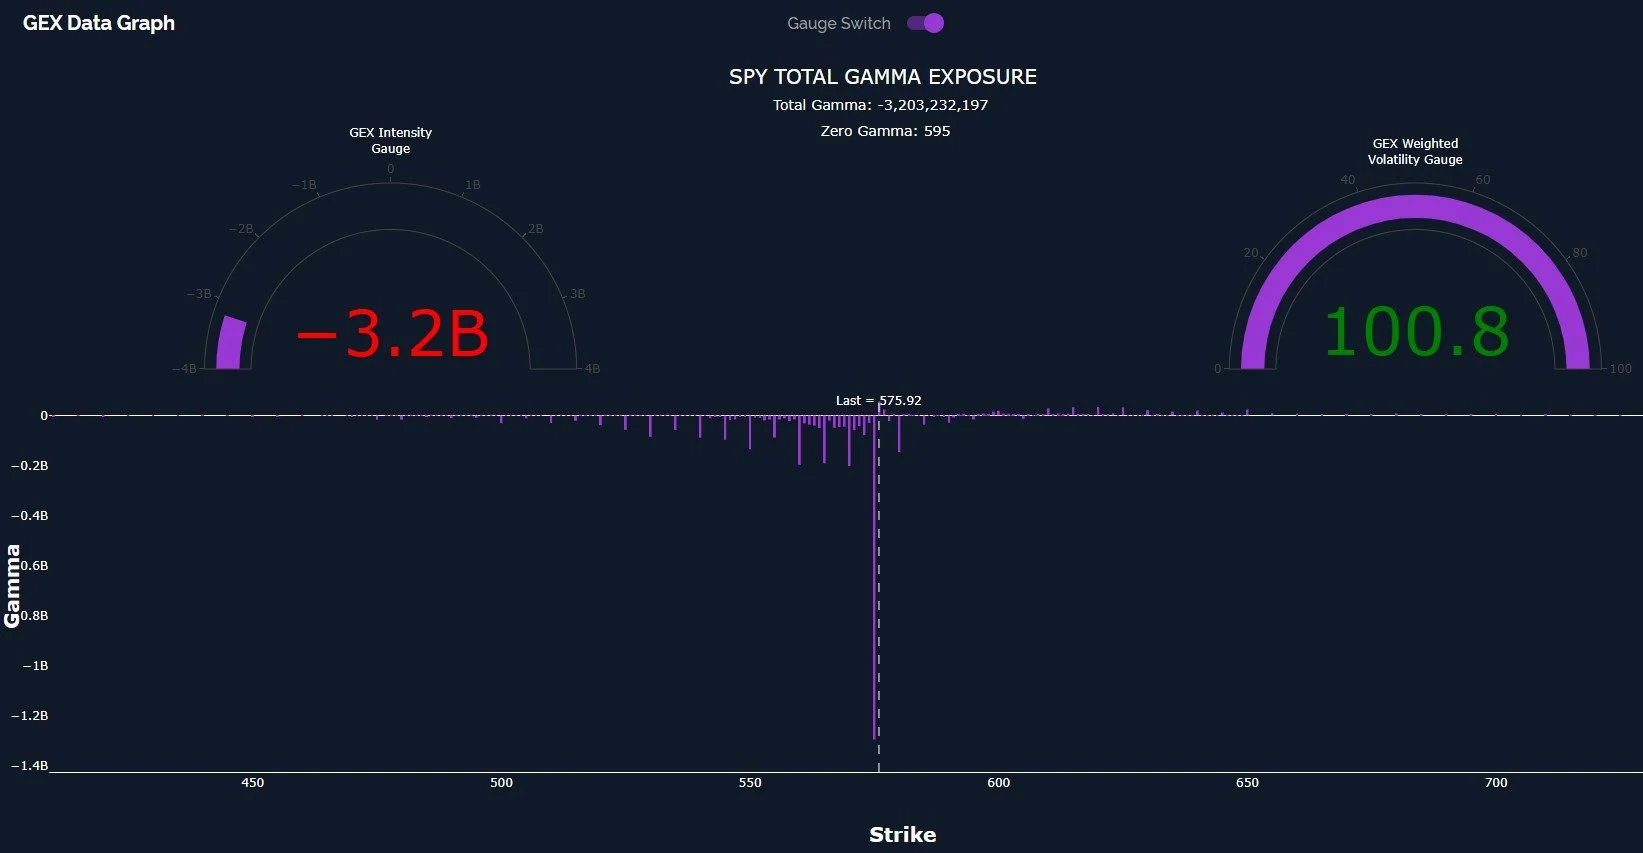
Furthermore, we still see SPY near a negative extreme, which has been a good contrarian signal in the past. Relative extremes are never exact in terms of timing or how extreme things will become, but in general, reaching these areas calls into question the risk/reward in what was the prevailing directional trend.
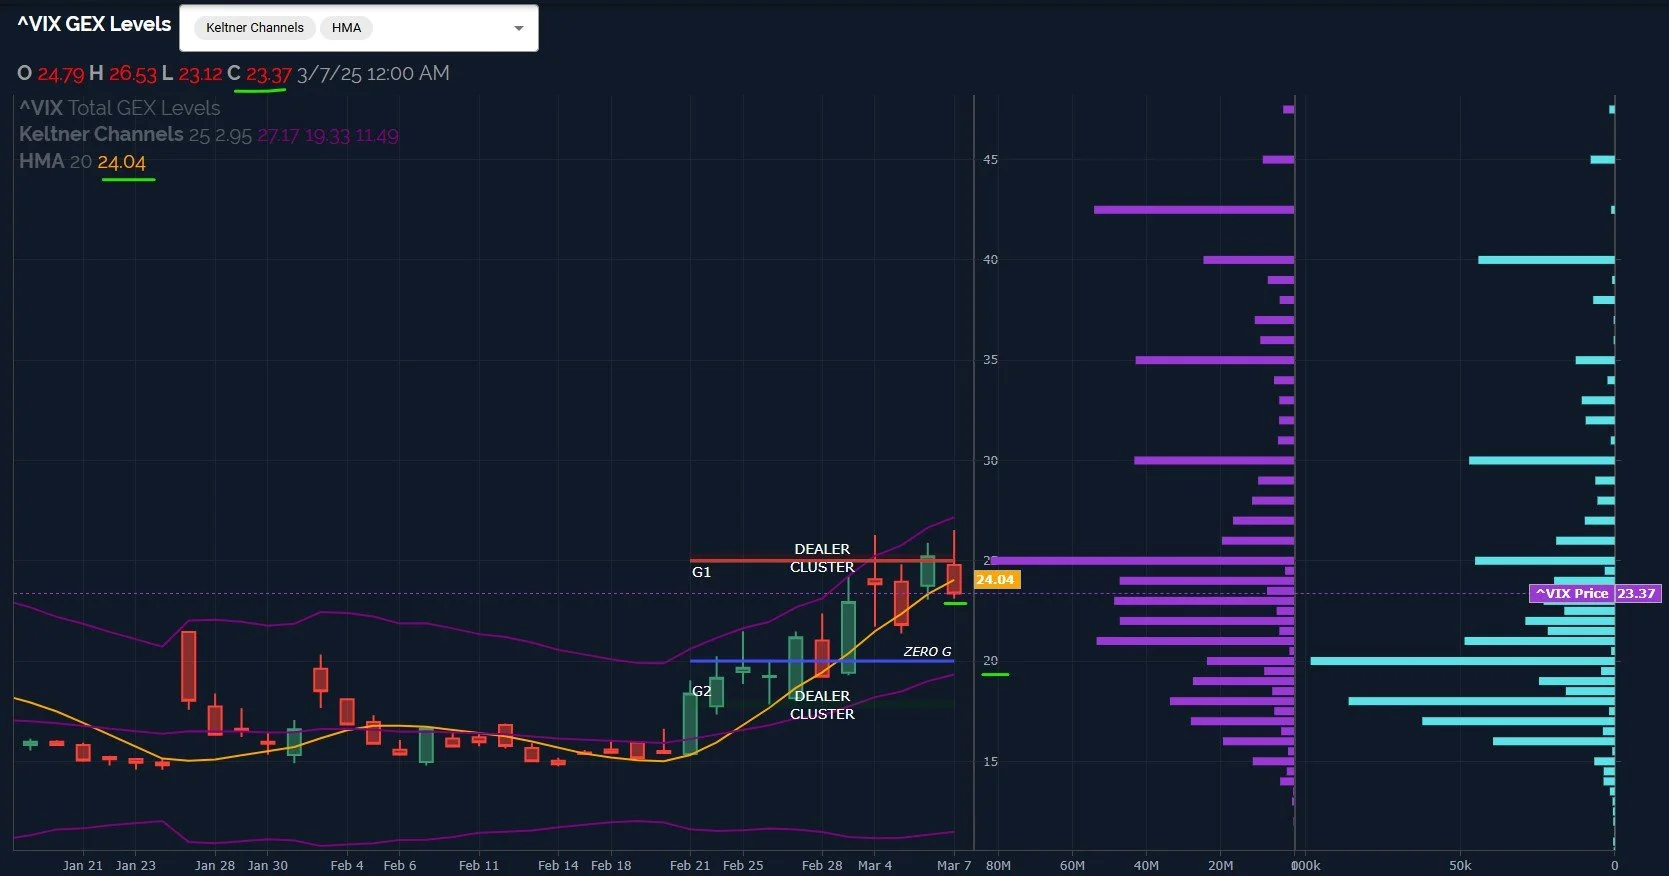
The VIX also gives bulls hope for the 2nd time in 3 days, closing below the Hull by roughly 2.5%, a solid close beneath the line. Keep in mind Wednesday we also saw a close below the line, but then we saw the VIX gap back above the line Thursday, so we aren’t out of the woods yet until we see continuation. It’s encouraging that the highest volume was at the 20 strike, followed by t he 18 strike. We still see volume and GEX at 30, 35, and 42.5, so we can’t ignore eventual expansion for the VIX to higher strikes.
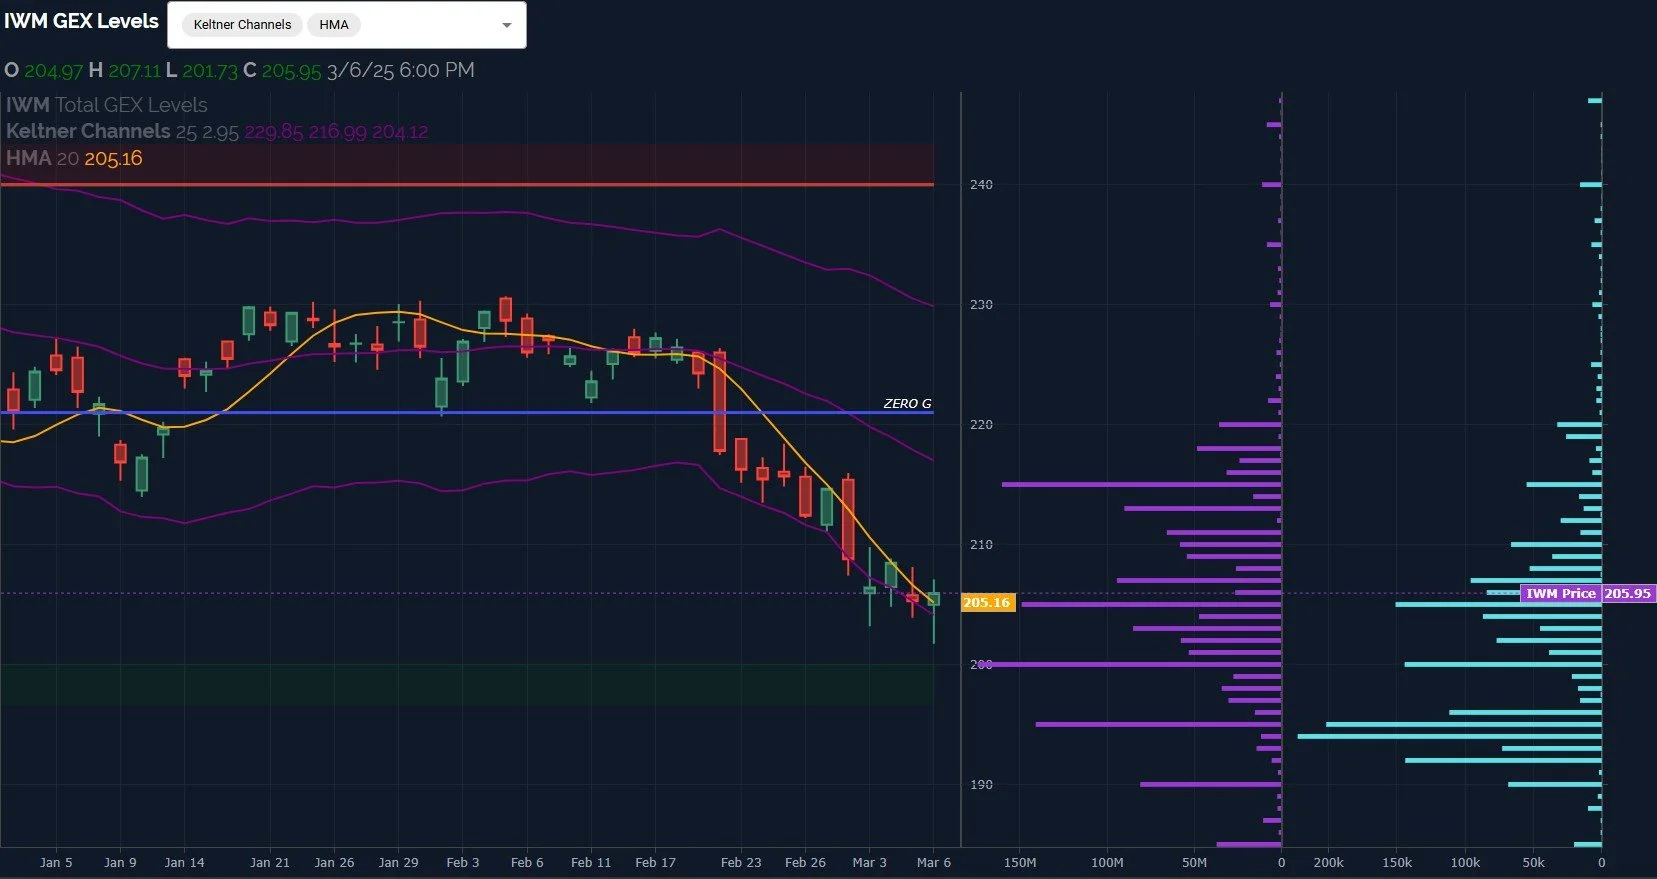
Here’s what I find most encouraging, other than the fact that DIA was positive from Tuesday through Friday: IWM closed above the daily Hull for the first time since February 18, and as regular readers are aware, I consider the Hull to be an important line-in-the-sand for a directional bias. Above the line usually means longs get paid, though we are admittedly very close to the line, conveying higher odds but not necessarily a guarantee (nothing is ever a guarantee anyway). IWM is very one-sided with negative GEX at the moment, and fairly close to a negative GEX extreme, conditions that support the idea of a quick move higher to lead the way for other indices. With big negative GEX at 215, we will watch what happens in that area to try and assess the likelihood for continuation above that line (also close to the middle Keltner channel) or failure again, which would be convincing of the potential staying power of this downward slide.
Here’s the Discord link if you haven’t joined us yet! Access is free for some channels, and new members have a 7-day trial within Discord to see how we operate. We have an active community of thoughtful traders who chime in throughout the day, sharing ideas and opportunities as we see them.
If you’re interested in accessing our tools and analytics, be sure to check out our website! We rolled out backtested algos and chart indicators and we have more improvements on the way!
If you’re interested in learning more about our strategy and approach, we address all of these topics in our Geek University course which is included in all memberships.
We recently posted a YouTube video, and we have many other short videos, so give our channel a look if you’re curious about recent market commentary and ideas as well as gamma (GEX) concepts explained.
Thanks for being part of our community and know that we invite your feedback!
The information provided by Geeks of Finance LLC is for educational purposes only and is not intended to be, nor should be construed as, an offer, recommendation or solicitation to buy or sell any security or instrument or to participate in any transaction or activity. Please view our Investment Adviser Disclaimer and Risk Disclosure.