
Starting February In The Red
2025 WINTER SUBSCRIPTION SPECIAL- Due to popular demand, we’re extending our Winter Special of $300 off of the annual Portfolio Manager subscription through the early part of February! We’re on the brink of rolling out even more new features, including backtested algos for our subscribers to use, so we hope you’ll join us for the ongoing improvement of our total offerings! Enter code WINTER2025 at checkout.
Thursday’s newsletter pointed to 1) an overall bullish shift in GEX across the board, and 2) near-term negative divergences that we felt warranted attention, even suggesting that Friday might see a move up to 6107 (we reached 6120) and down potentially 70 points from there (we actually dropped 80 points to 6040). We are wrong sometimes too, but I think it’s a good example of combining technicals and gamma (GEX) to improve one’s odds of having an idea of what the market may look like in the near term. Since we’re on the pathway of a VIX spike and a continuation of the decline, let’s look at the next possible levels that we’ll be watching. We also discuss complementary related points in today’s YouTube video, which you can watch by clicking here.

The chart above shows ES futures, which we don’t currently cover in our list of 600 tickers on our GEX dashboard, but we will eventually include it, and it gives us a preview of SPY and SPX in terms of the next day. Vicious gap down tonight, with ES currently down -125 points, and you can see that the price at the time of my screenshot (actually 5940 now based on current prices) places ES well below the daily middle Keltner channel. 5786 is the bottom of the channel, seemingly the distance of the Grand Canyon, so let’s look at other potential areas of support using different timeframes. We’ll do that right after we take a quick look at the VIX.
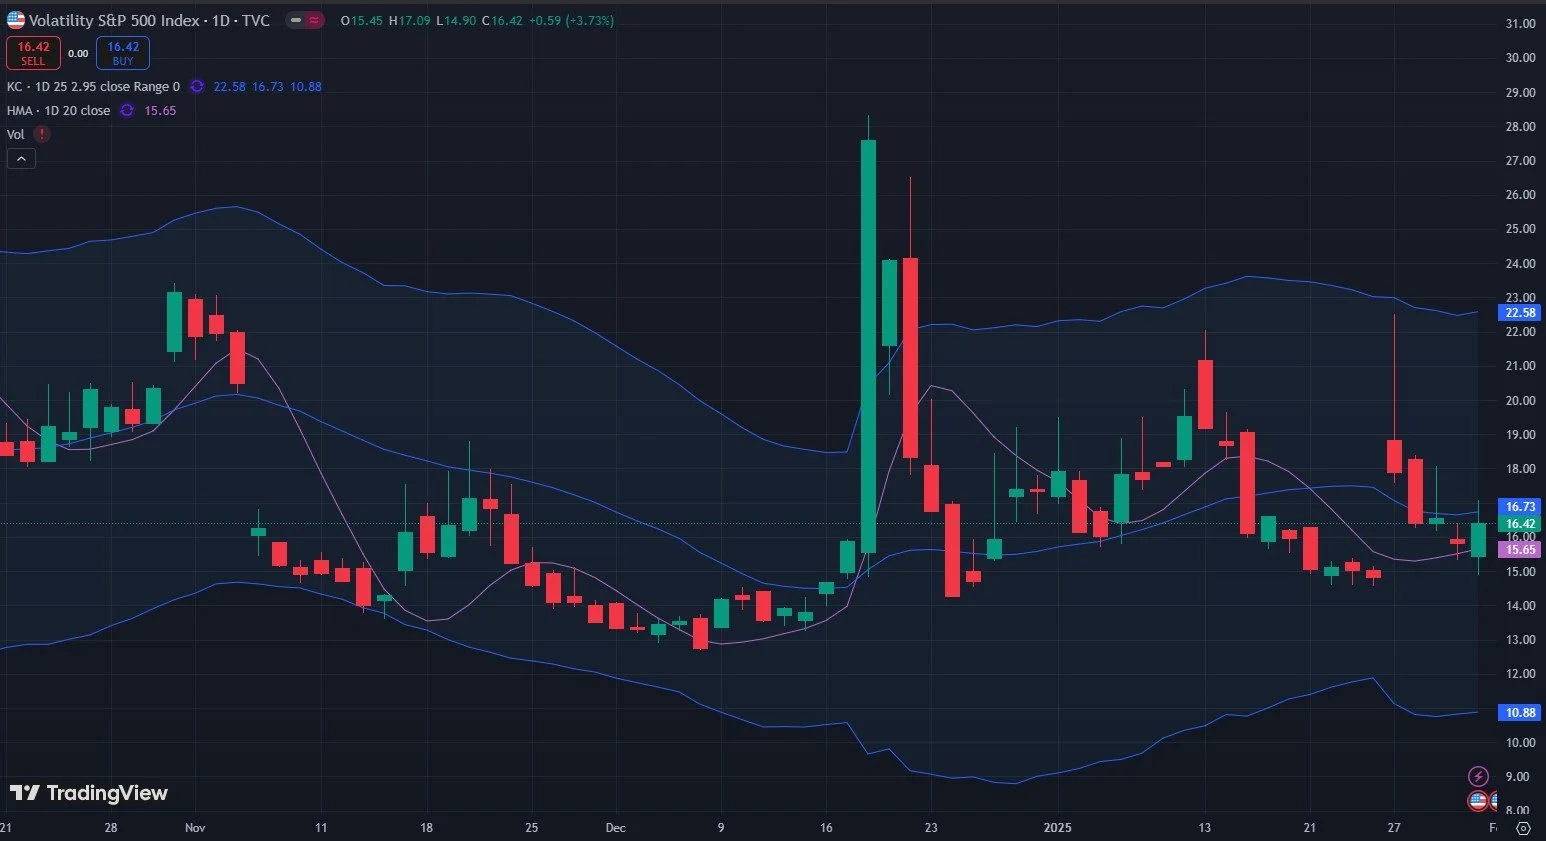
Part of our caution toward the VIX (meaning a possible bullish volatility setup) was based on a number of VIX:VVIX divergences, the VIX holding the 2-hour Hull moving average, and closing the gap from Monday’s gap up in the VIX. Based on the Keltner channels above, 22.58 is the top channel, though any observation of past VIX spikes easily shows that the VIX rarely stays within the boundaries when it’s really excited. The degree of excursion beyond the lines varies.
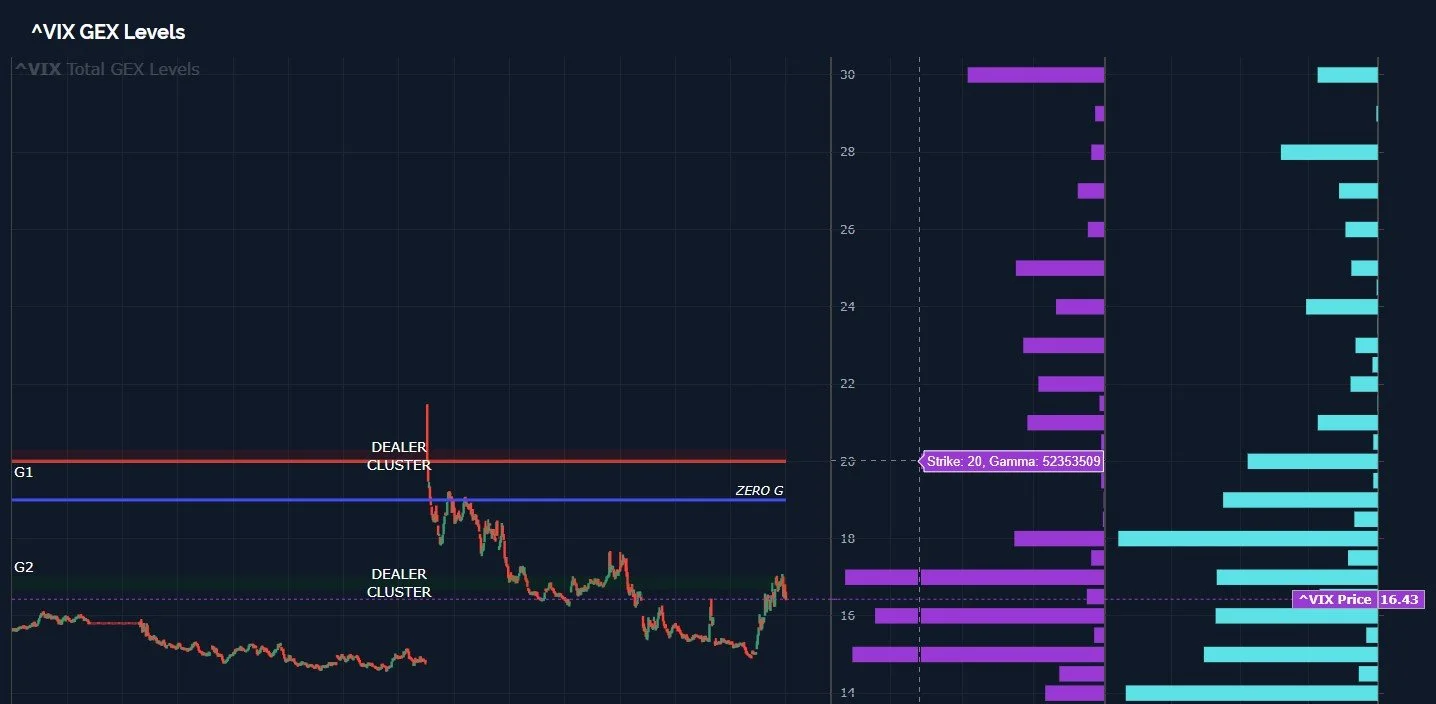
The VIX GEX Levels chart below, from our website, shows sizable GEX at 20, and some smaller clusters beyond that, with 30 being a big one. We’ve noted unusual volume at 30 for awhile, but I consider any near-term projection of 30 to be quite speculative, expecially given that VIX options are sometimes used for hedging purposes. But note that a move beyond VIX 25 may have 30 as the next “magnetic” level thanks to the GEX clustered at that area.
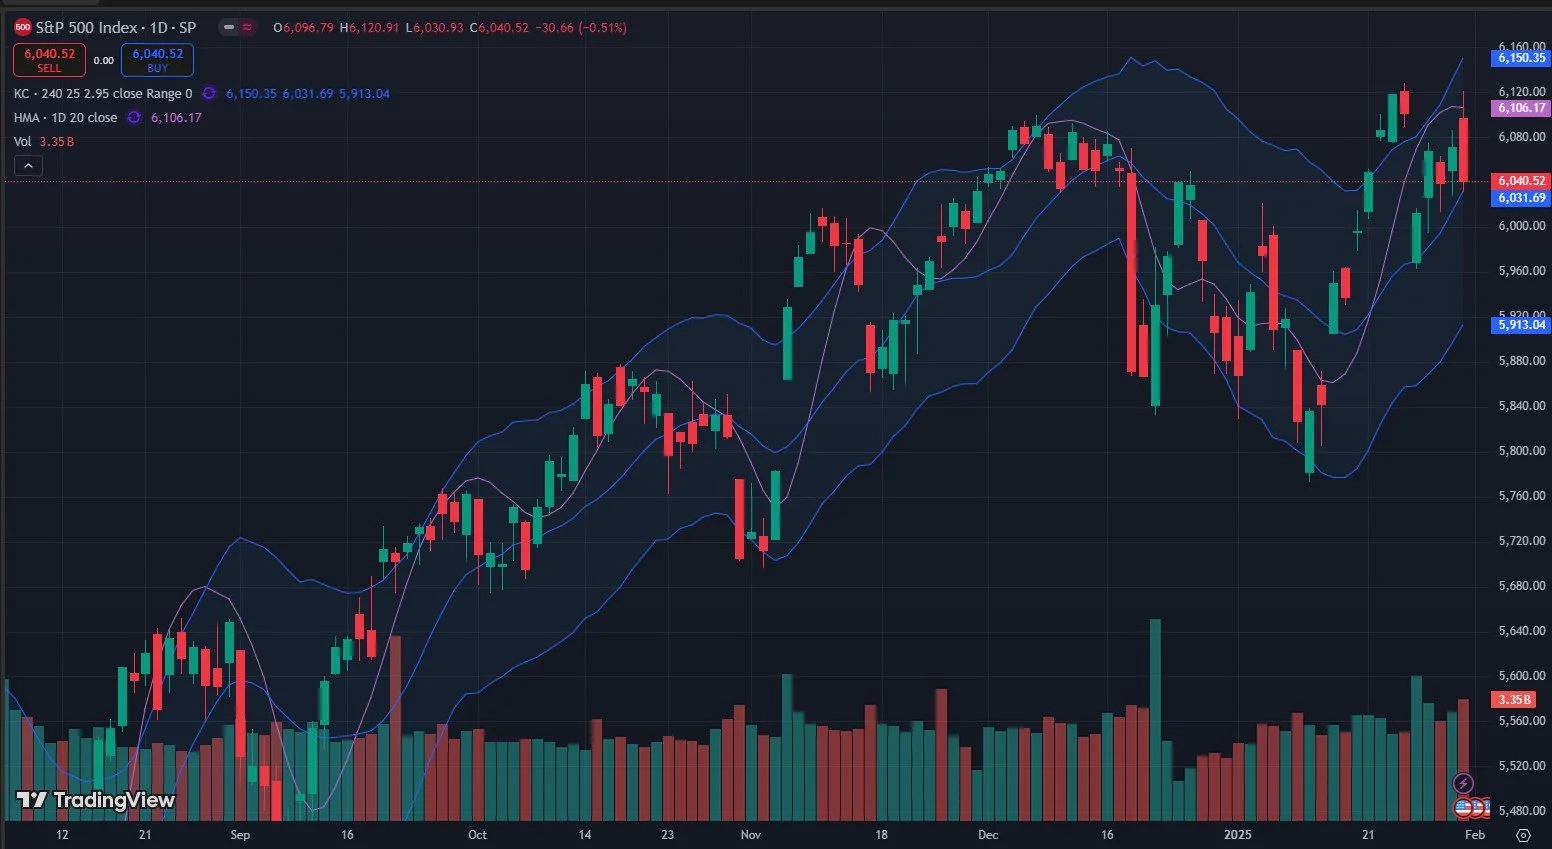
Now that the doom and gloom has been covered, let’s come back to SPX, which we can relate to ES given that they’re almost identical twins (I’d throw SPY in this mix too, and we won’t leave out SPY). ES is roughly 27 points higher than SPX, so ES 5940 is roughly SPX 5913. Why do futures keep bouncing around this level? Well my goodness, the magical Keltners strike again, I pulled up the 4-hour chart and 5913 is the bottom level. I will note that the 4-hour chart looks very bullish, with the Keltners aiming nearly straight up. Pointing out the 4-hour support doesn’t guarantee a rebound, but it shows the significance of the level (to me), and holding below that level for a 4-hour bar would start looking very bad, potentially opening the door to the lower levels on the larger timeframes. Okay, so there’s a potential argument for buying this dip as soon as tomorrow.
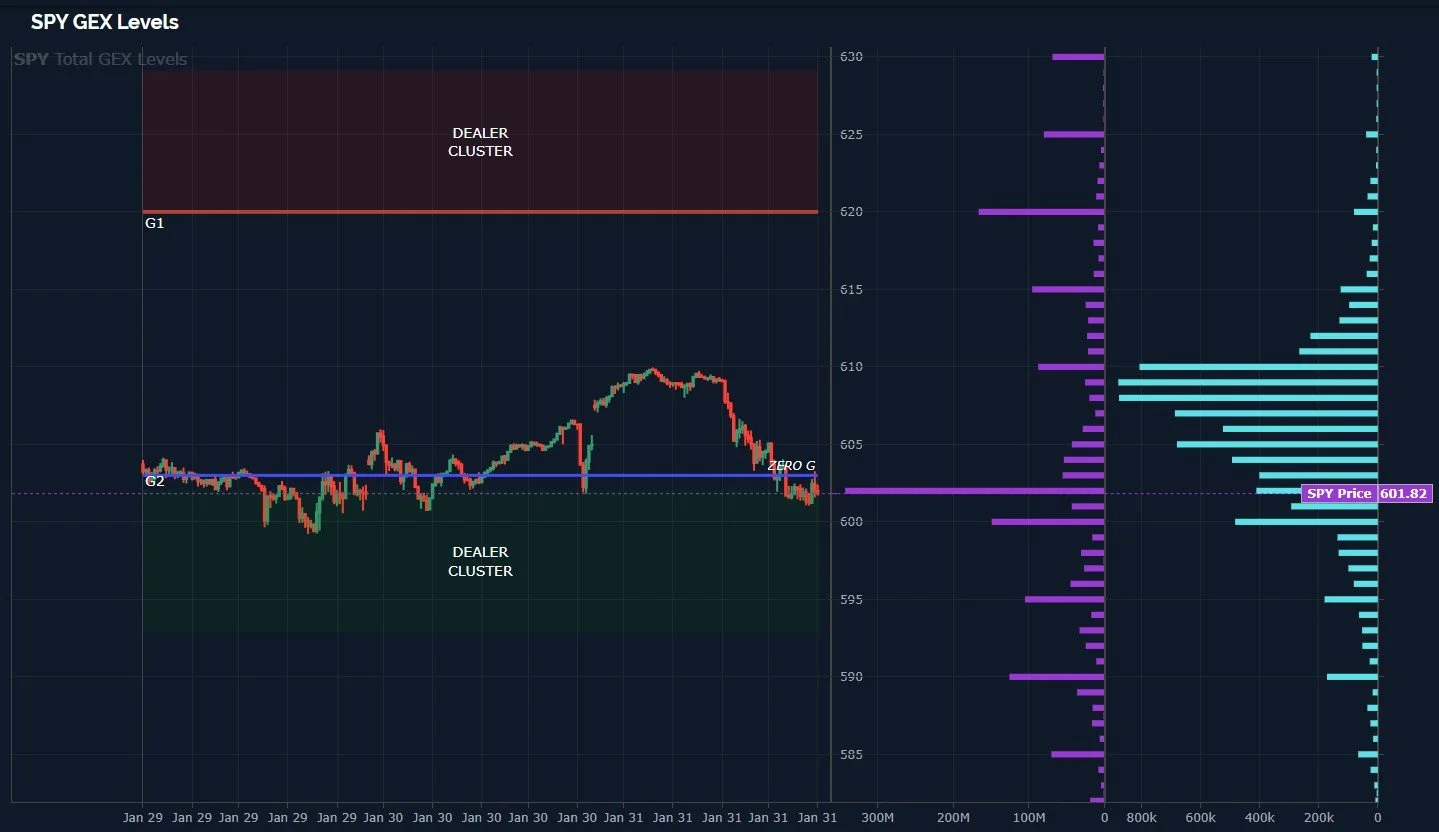
One quick note about SPY- tomorrow’s open will place SPY just below the green box, which theoretically may tilt risk/reward even more toward the long side, but we want to see how these levels shift after tomorrow’s open. Our Dealer Cluster zones shift just as often as our GEX updates, every 30 seconds, so we can see these areas move around a bit during the day. I choose to use the levels at the end of the day to identify areas I want to watch, for the most part, especially since intraday we’re just pulling up the 0 DTE GEX in our 0 DTE Discord channel, which really helps with the focus on different timeframes.
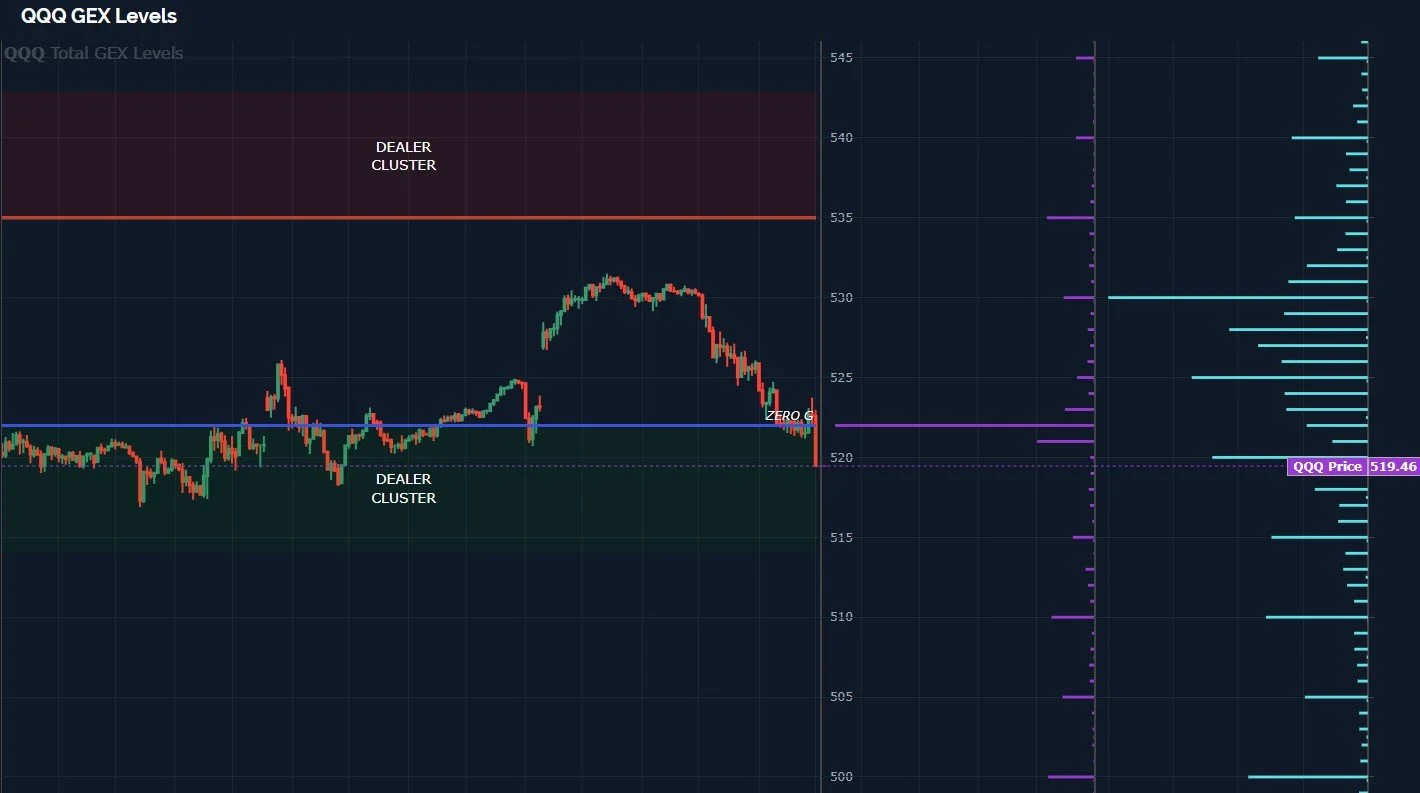
NQ has shown some interesting behavior tonight, dropping below the 4-hour Keltner but regaining it, seemingly determined (for now) to hold that area. When the market is dropping, all night seems like a long time, so we’ll see if it holds (the equivalent to roughly 509-510 QQQ), but successful attempts to push price lower may aim for QQQ 498-500, the lower Keltner channel.

QQQ’s GEX levels are skewed by the big 0 DTE GEX that will roll off in the morning, so excluding that, yuo can see 500 and 510 are actually very significant GEX clusters, further evidence that the options market is positoned in a way that we may see consolidation at those levels (whichever comes first).
This would be quite oversold for even a one-day move, so a dip buy may become interesting, though longer term ramifications will require revisiting. Similar to the Hull representing support-turned-resistance last week, which saw failure of price to overcome, we will now have even more levels above to represent hurdles to overcome. We’ll continue taking it play-by-play!
Here’s the Discord link if you haven’t joined us yet. Access is free for some channels, and new members have a 7-day trial to see how we operate. We have an active community of thoughtful traders who chime in throughout the day.
If you’re interested in accessing our tools and analytics, be sure to check out our website! More improvements coming in February!
If you’re interested in learning more about our strategy and approach, we address all of these topics in our Geek University course which is included in all memberships.
We recently posted a YouTube video, and we have many other short videos, so give our channel a look if you’re curious about recent market commentary and ideas as well as gamma (GEX) concepts explained.
Thanks for being part of our community and know that we invite your feedback!
The information provided by Geeks of Finance LLC is for educational purposes only and is not intended to be, nor should be construed as, an offer, recommendation or solicitation to buy or sell any security or instrument or to participate in any transaction or activity. Please view our Investment Adviser Disclaimer and Risk Disclosure.