
Love Is In The Air
2025 WINTER SUBSCRIPTION SPECIAL- Due to popular demand, we’re extending our Winter Special of $300 off of the annual Portfolio Manager subscription through February! Either this weekend or early next week, we’ll be rolling out even more new features, including backtested algos and indicator overlays, so we hope you’ll join us for the ongoing improvement of our total offerings! Enter code WINTER2025 at checkout.
Looks like the market made up its mind today, with indices rocketing to recent highs and breaking out of the consolidation we’ve experienced for weeks. While there’s no guarantee that we see a mid-month high or low, if the pattern of important highs and lows repeats this month, we may make a short-term top between tomorrow and Monday. The VIX has broken below the Hull moving average on various timeframes and the next levels of interest I see on my charts lie between the 14-14.5 strikes for the VIX. The VIX closed at 15.10, just above a big Dealer Cluster zone we show at 15, so it’s possible we don’t get a final spike lower toward 14. Given the momentum today and with tomorrow being Friday (and Valentine’s Day), I wouldn’t be surprised if the market is shown a lot of love, at least for part of the day. We discuss the broader market, the VIX, and a number of individual tickers like TSLA and NVDA in today’s YouTube video, so check it out by clicking here.
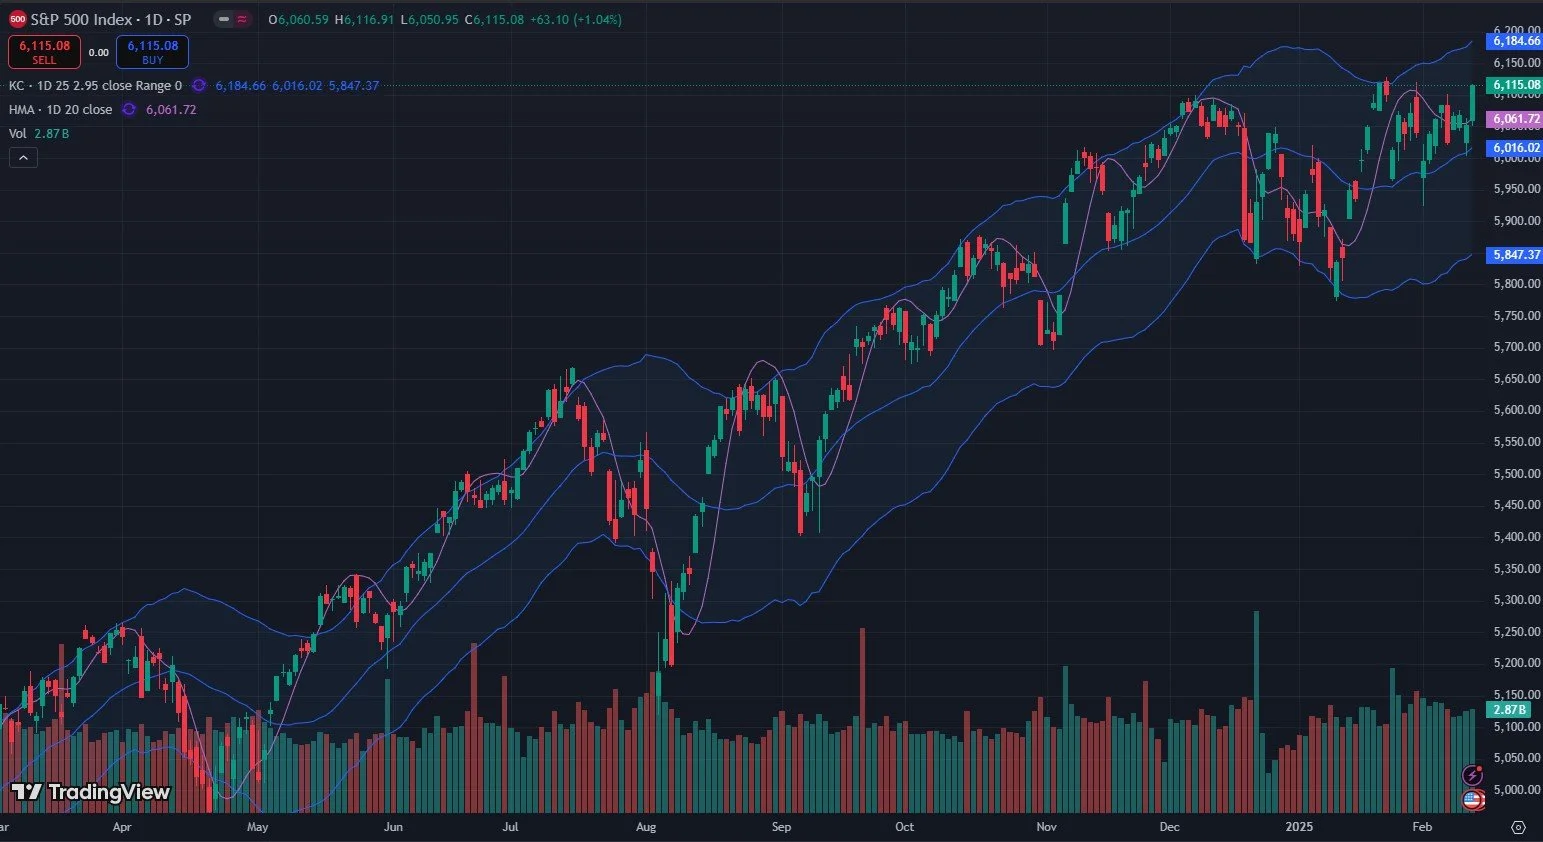
We can see on the chart above that SPX has broken above the Hull with strength, closing at 6115 and appearing well on its way toward the upper Keltner channel near 6200, a big GEX level we’ve highlighted recently.
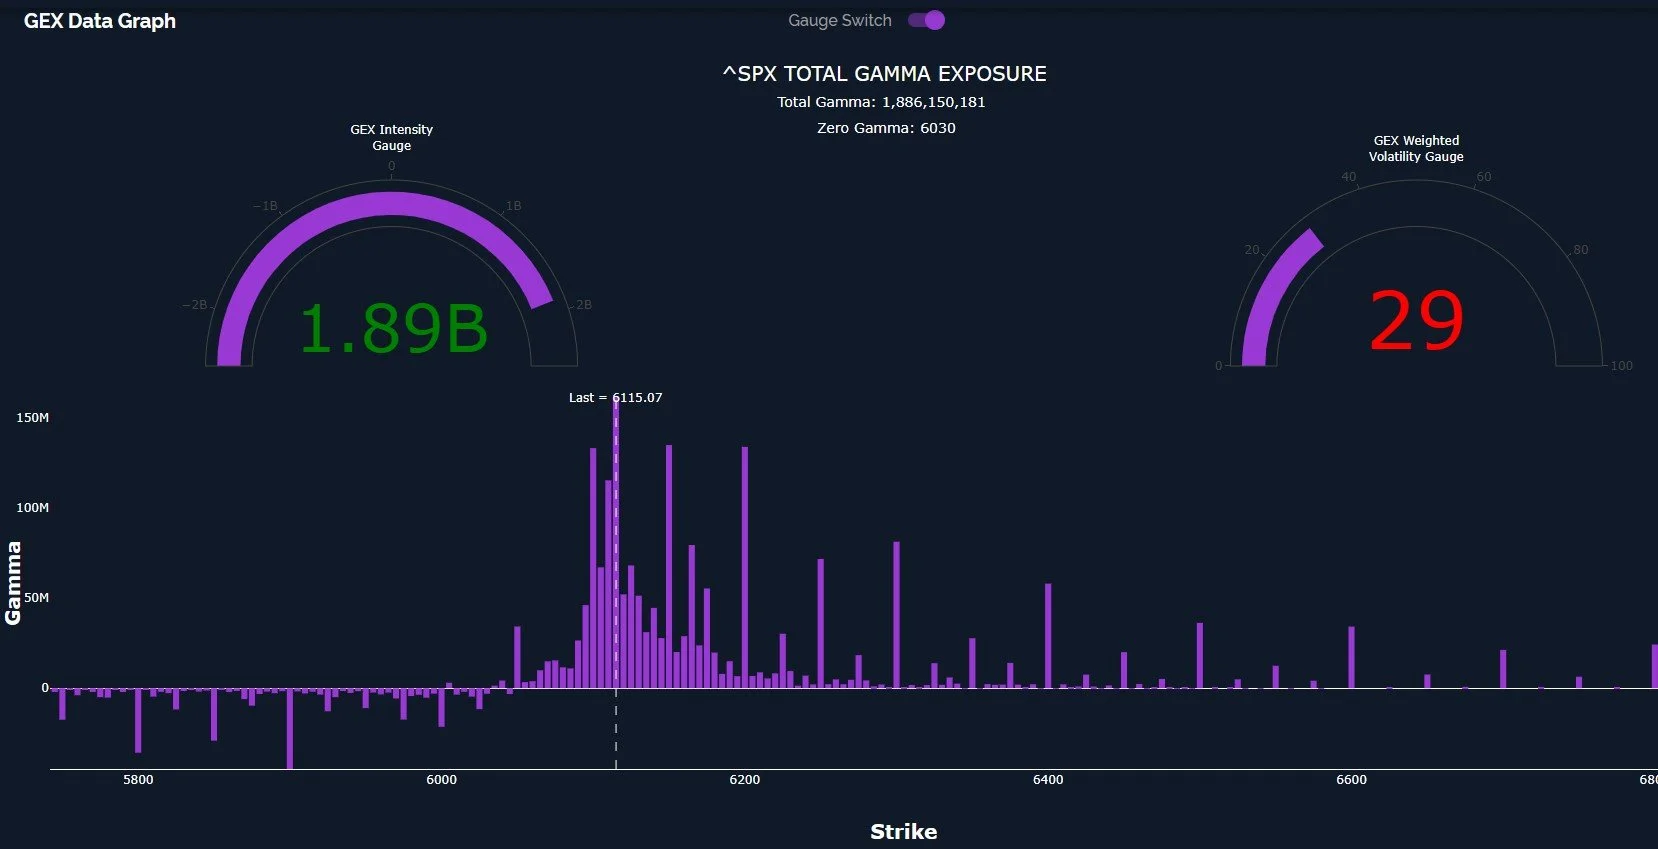
Total net gamma exposure (GEX) is very positive, and in fact we are approaching levels that are extreme relative to the last 52 weeks, which is what our GEX Intensity Gauge shows. Extremes shown on the gauge are areas where contrarian reversals can occur. Coupled with the fact that the VIX is at an important area around 15 (even if we overshoot to 14), we could easily see a brief, sharp pullback in the context of marching (no pun intended) higher into late March where we see most of the 6165-6200 GEX clustered.
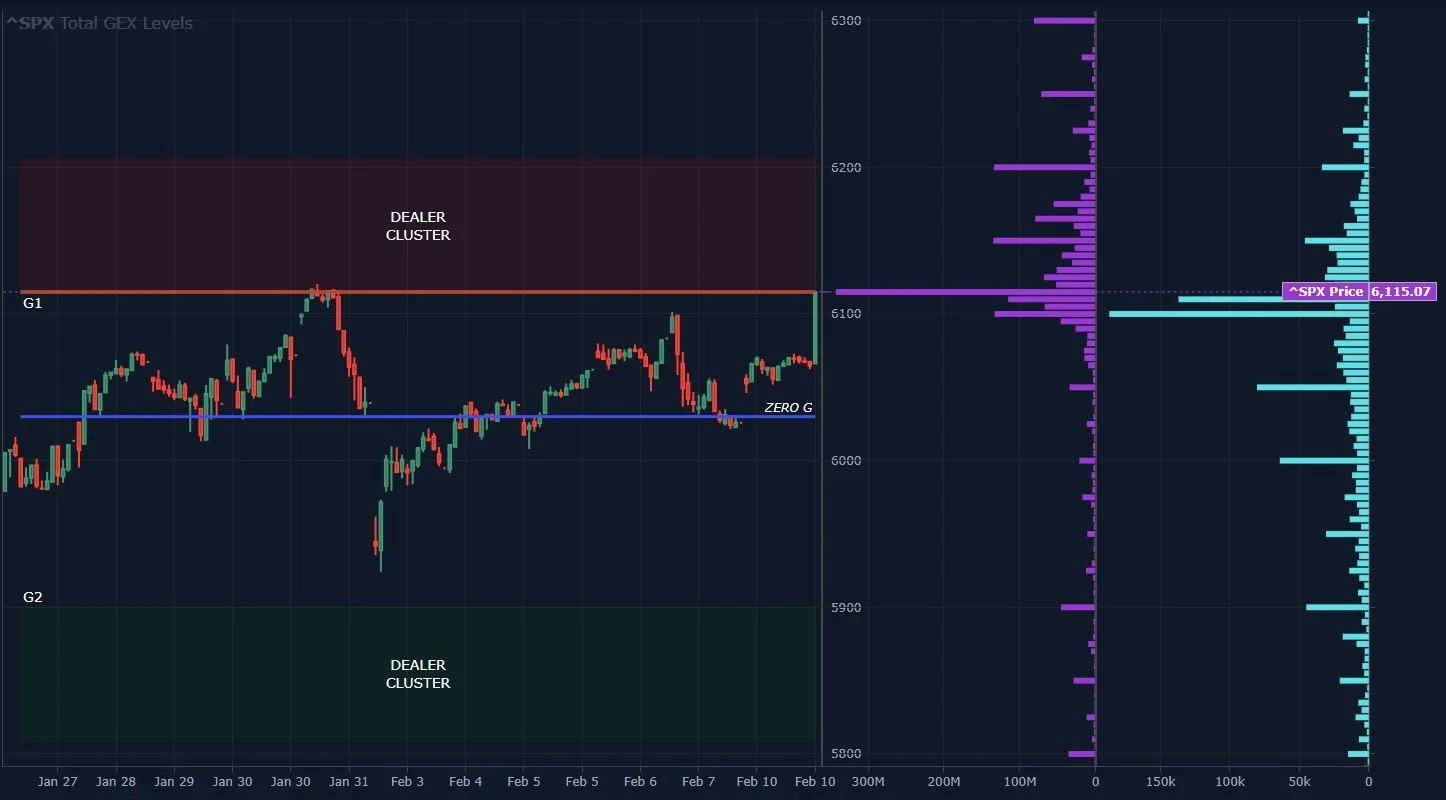
The GEX Levels chart below gives us a different view of similar points: We are in the upper Dealer Cluster zone, but we still have substantial GEX clustered at higher strikes, particularly 6150 and 6200, but all the way up to 6300-6400 as well. Paradoxically, notice volume was more heavily weighted toward lower strikes. Hence the currently speculative idea that we could see a pullback at any moment, though as long as the GEX picture maintains those higher strikes into late March, we will view any such dip as a dip buying love fest (trying to keep the Valentine’s theme going here, cut me some slack!).
QQQ’s overall chart configuration does not look as bullish to me, with the Keltners in more of a sideways consolidation pattern than the bullish view of SPX, but we see a similar picture in that the price is above the Hull and we are well on our way toward the 540+, the top of the G1 Dealer Cluster zone.

QQQ’s zone finally shifted higher, moving from 530 to 535 as the lower edge, with the upper edge of the box nicely matching with the approximate level of the upper Keltner channel near 543. This shift is what we expect in a bullish environment, but the same caution now applies that we see with SPX, the risk of a short-term pullback with a constructive buy-the-dip view toward March.
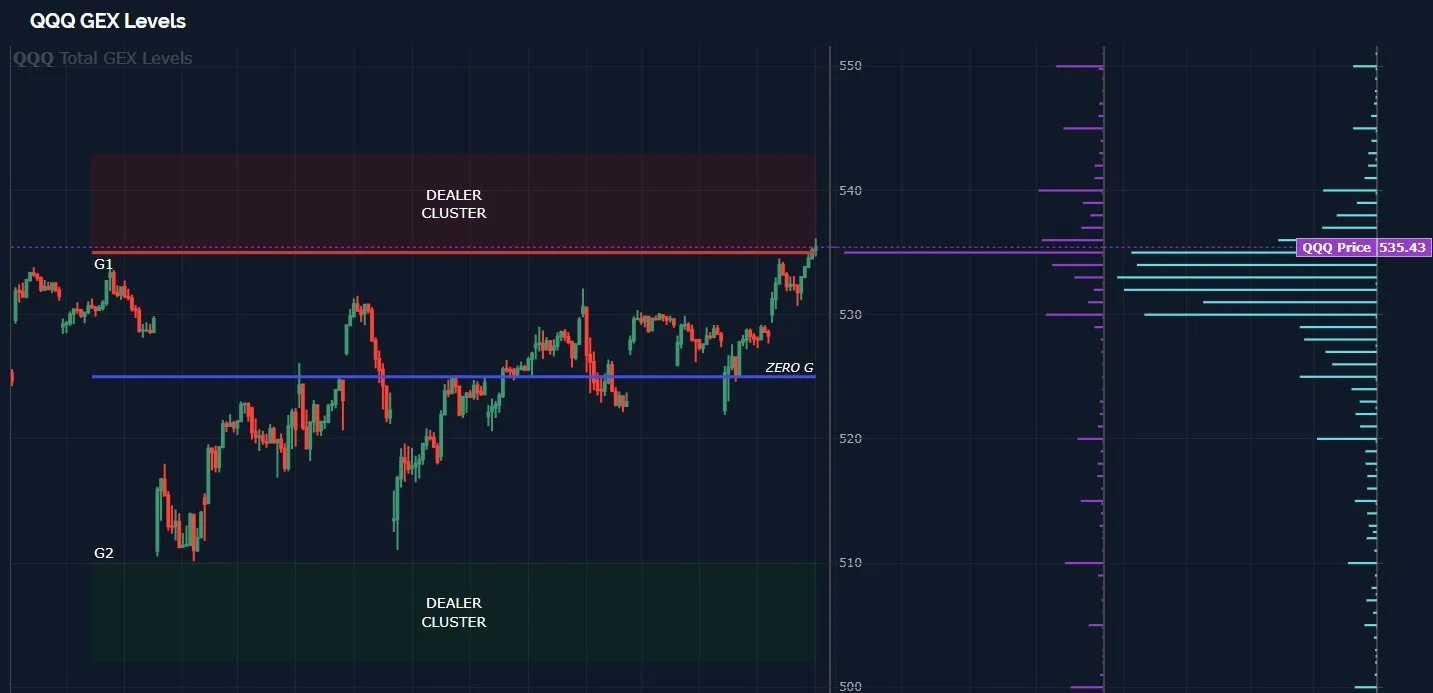
Speaking of contrarian, QQQ’s total net GEX increased dramatically to almost 671M today. This exceeds the January 22 GEX high by 36M. Note that January 22 was 2 days before QQQ topped out and fell off of the high dive. GEX began declining fairly sharply over those next two days as the market rose, so we don’t always get a divergence signal in advance, but that time we were forewarned by GEX. Will this time be different? It’s possible. We’ll be watching for signs of a shift tomorrow, potentially including an intraday trend change tomorrow or Monday. Join us and we’ll discuss these shifts as we see them happening.

Here’s the Discord link if you haven’t joined us yet. Access is free for some channels, and new members have a 7-day trial to see how we operate. We have an active community of thoughtful traders who chime in throughout the day.
If you’re interested in accessing our tools and analytics, be sure to check out our website! More improvements coming in February!
If you’re interested in learning more about our strategy and approach, we address all of these topics in our Geek University course which is included in all memberships.
We recently posted a YouTube video, and we have many other short videos, so give our channel a look if you’re curious about recent market commentary and ideas as well as gamma (GEX) concepts explained.
Thanks for being part of our community and know that we invite your feedback!
The information provided by Geeks of Finance LLC is for educational purposes only and is not intended to be, nor should be construed as, an offer, recommendation or solicitation to buy or sell any security or instrument or to participate in any transaction or activity. Please view our Investment Adviser Disclaimer and Risk Disclosure.