
Market On A Mission
2025 WINTER SUBSCRIPTION SPECIAL- Due to popular demand, we’re extending our Winter Special of $300 off of the annual Portfolio Manager subscription through the early part of February! We’re on the brink of rolling out even more new features, including backtested algos for our subscribers to use, so we hope you’ll join us for the ongoing improvement of our total offerings! Enter code WINTER2025 at checkout.
Can you believe it, another day goes by and we are back here (again) evaluating a market that can’t make up its mind. Volatility (referring to the VIX specifically) that is near an area where we might see a reversal and increase in volatility, QQQ looking more bearish than the S&P, and SPX really signaling good odds of reaching 6200 by the end of March. Obvious conclusion: One or more of these are likely to change in coming days/weeks. Other than a pair trade (long SPX and short QQQ, as an example), what can we do with this information? Let’s take a closer look at potential clues. We also make some points that we believe to be very relevant in today’s YouTube video, which you can view by clicking here.
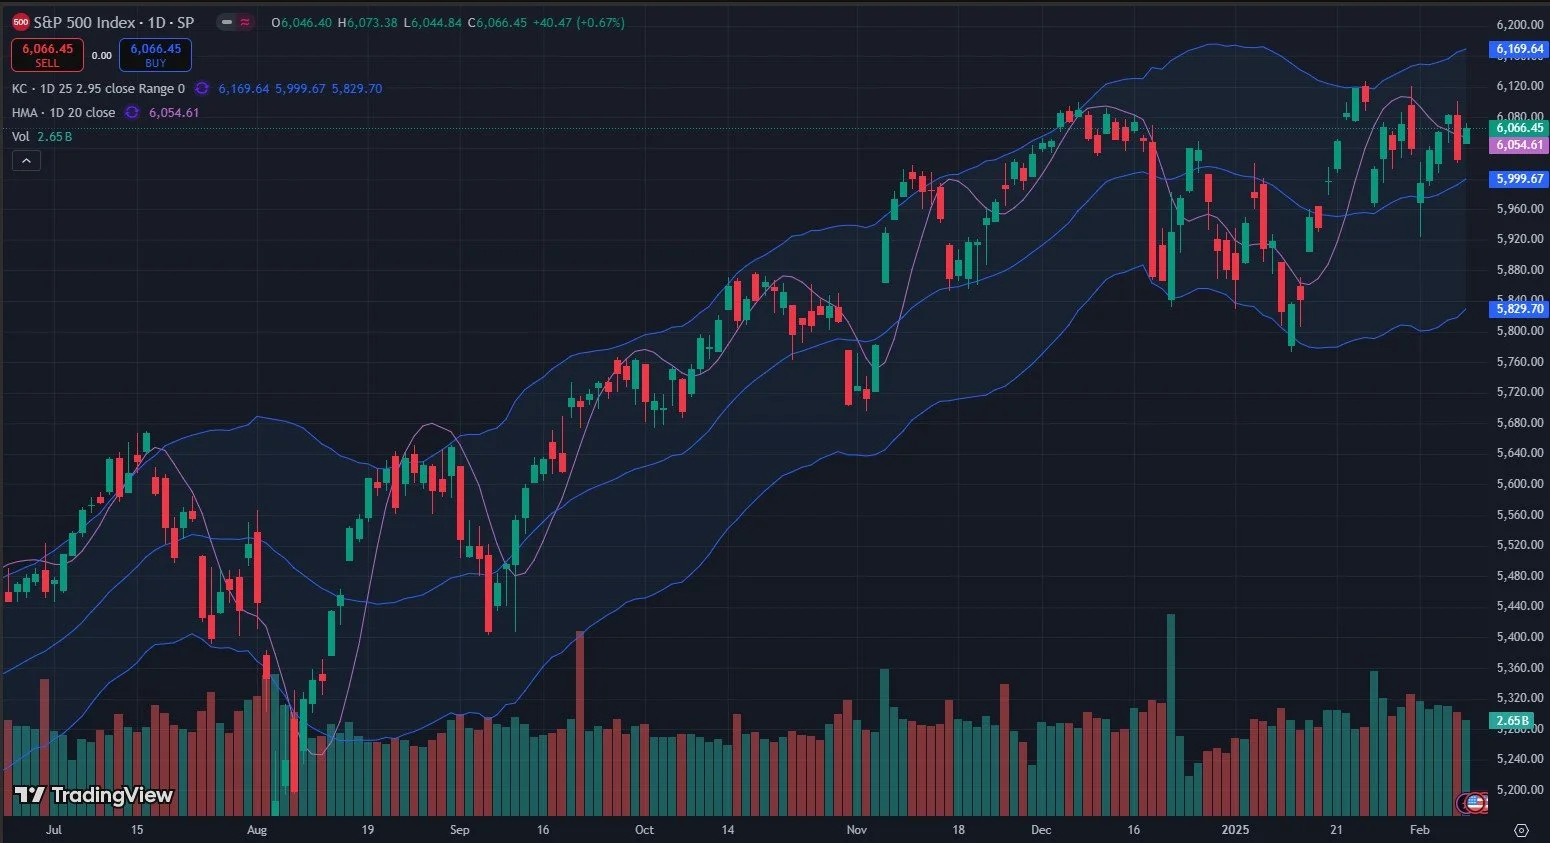
SPX regained the Hull Moving Average, as shown above, and the Keltners are starting to point higher. It doesn’t take a Pablo Picasso interpretation expert to look at the pattern forming and say “okay, maybe this is a rough triangle pattern that will break upward (we can treat the low candle as a form of creative art).” The proble with chop is that yesterday we closed below the Hull, triggering a short signal for me, then today we close above the Hull, a long signal, but we have to draw our conclusions from more than one data point, and from my view, the picture is definitely buy-the-dip as gamma (GEX) continues signaling that higher prices are ahead.
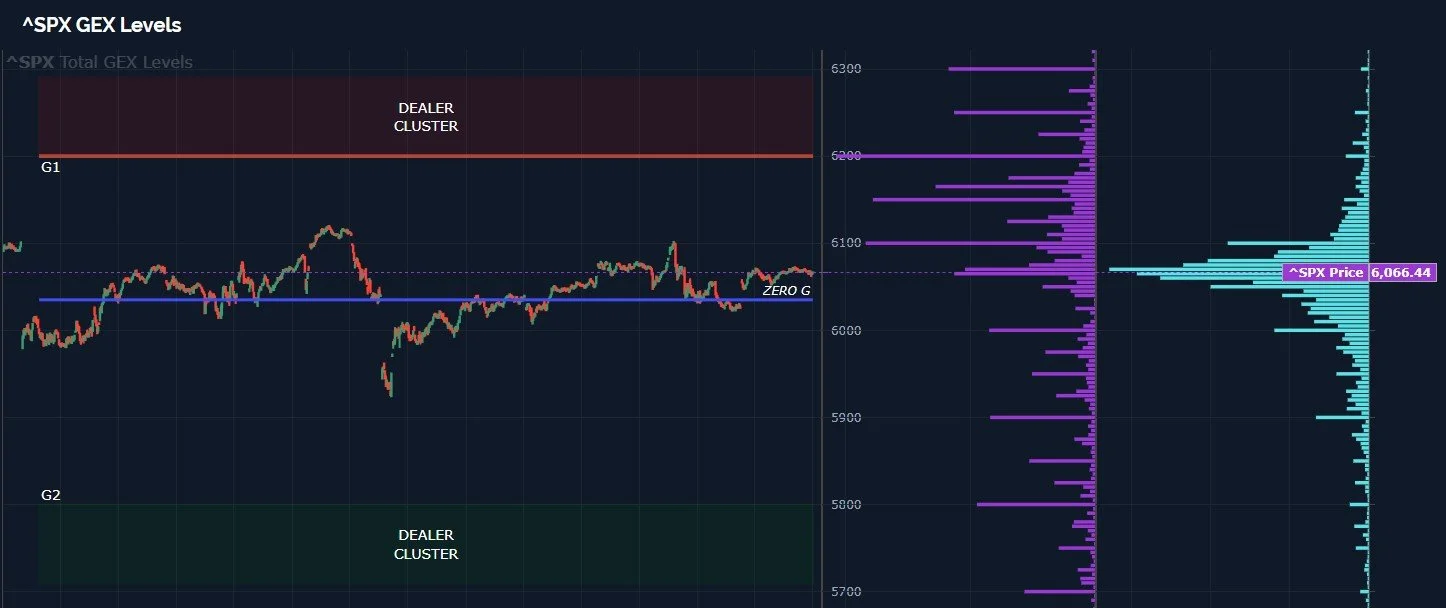
Our GEX Levels chart reflects total net GEX at all strikes (purple, with GEX below the zero line being negative) and today’s volume in light blue to the right. While toying with this zero gamma line for days on end, the GEX at higher strikes has grown, with 6200-6300 showing formidable concentrations. The positive GEX clusters are significant relative to the negative clusters below. It is interesting (to me) that the highest volume that was also farthest away from the spot price was at the 5900 strike, a negative, but the volume at 6100 also stands out.
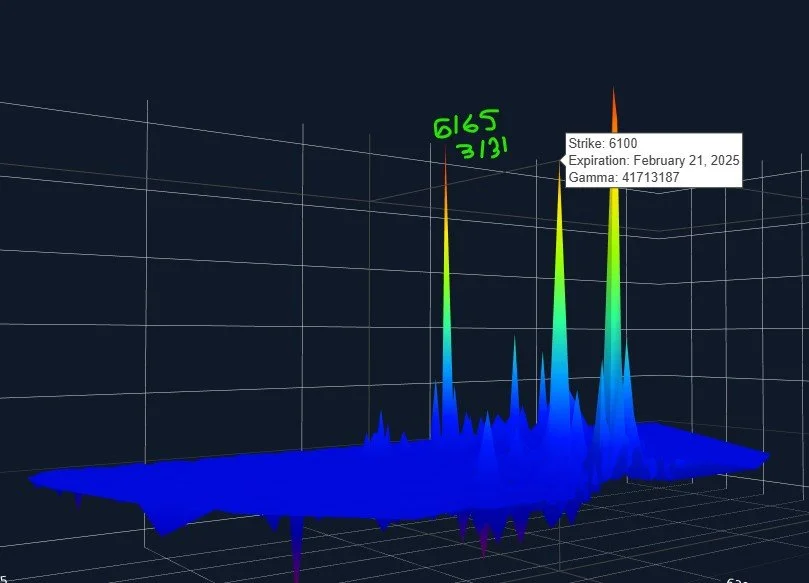
Can we ascertain any other clues from the 3D graph, which show all GEX clusters at every strike and date? Good question, thank you for asking. Other than the largest cluster attributed to today’s close, 6100 stands out as a major cluster for Friday, 2/21, and 6165 on 3/31. While we see 6200 as a large overall net GEX cluster, the expirations are a bit more spread out, hence the lack of one singular large expiration.
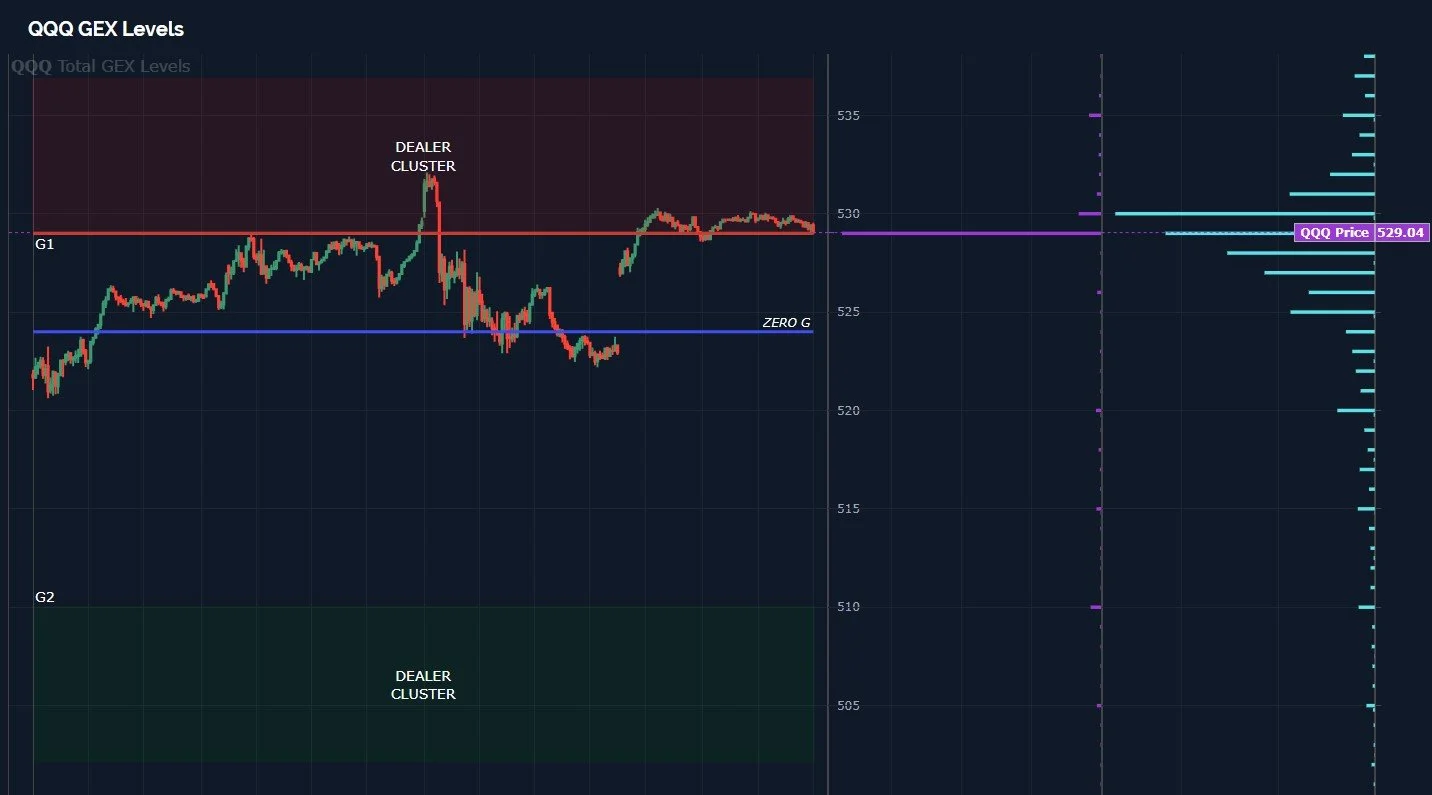
QQQ GEX Levels haven’t changed much, we still see QQQ at the lower edge of the upper G1 Dealer Cluster zone, which stretches just beyond the 535 strike. Certainly a less bullish picture than SPX, with potentially 1% or so upside, but we did see QQQ total net GEX go from fairly negative to positive 389M, a wide swing. If QQQ continues toward the higher edges of the zone, where does it find the fuel?
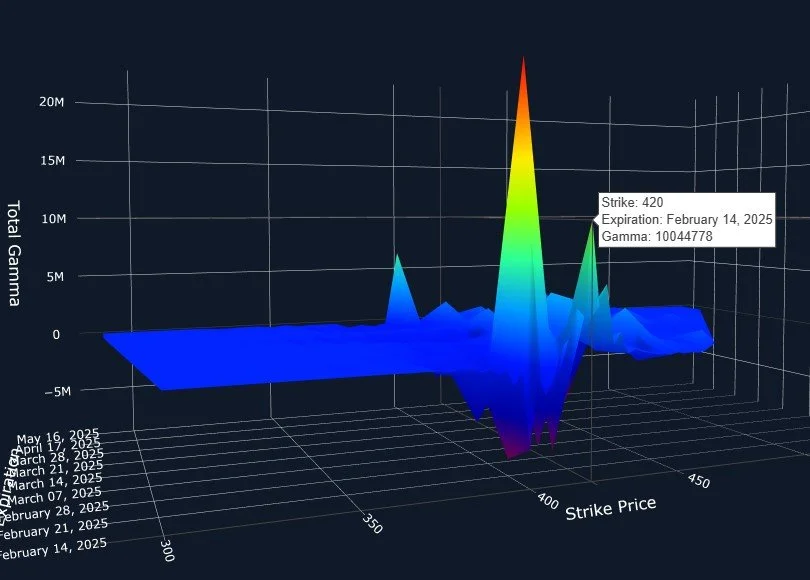
Glancing over some of the Maleficent Seven, I mean- Magnificient Seven, I see a lot of names that would normally signal caution for QQQ, but MSFT stands out as one of the “big ones” that might be able to step up and lend a hand toward crossing the finish line. Sideways price consolidation has allowed MSFTs Hull to cross below the price, creating a defacto bullish signal for me. While there’s some distance between 412 and 403, the Hull is just above 409, which may be a possible line-in-the-sand, depending upon one’s time horizon and risk tolerance. Upside potential (if the Hull holds) looks like 424 at first stop and then 447 if holding above 425.

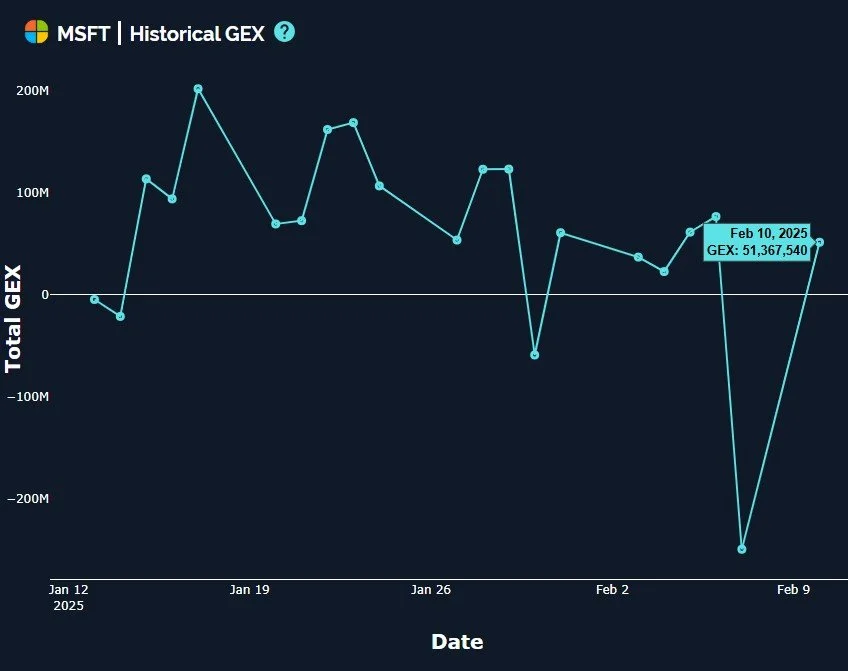
Somewhat similar to QQQ, MSFT GEX made a dramatic swing from negative to positive between Friday’s and Monday’s close.
GEX seems to support the middle Keltner with substantial GEX and volume between 420-430, and the recent consolidation has maintained itself above the zero GEX line.
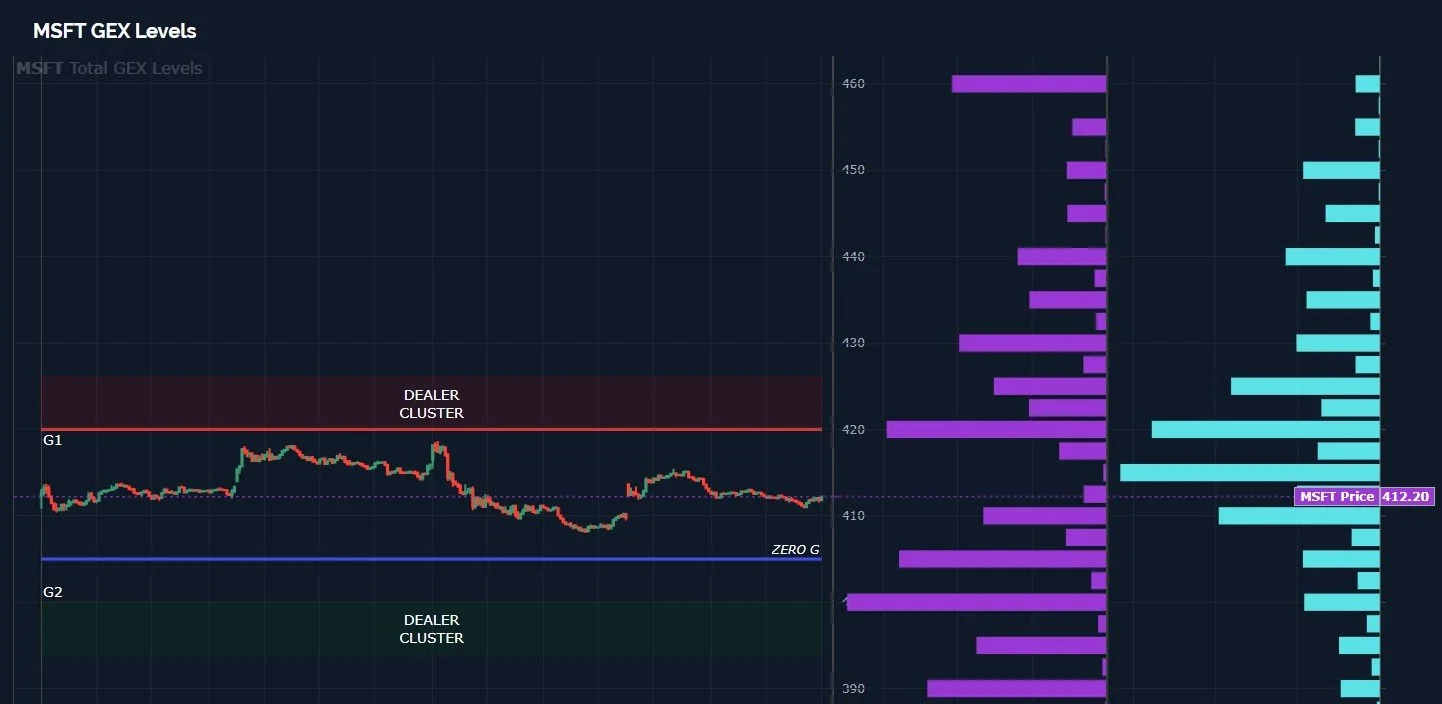
This Friday’s largest GEX cluster is at 420, within 1% of the middle Keltner, also potentially signaling near-term potential for higher prices before we need to re-evaluate MSFT’s prospects.
Here’s the Discord link if you haven’t joined us yet. Access is free for some channels, and new members have a 7-day trial to see how we operate. We have an active community of thoughtful traders who chime in throughout the day. We’ll be analyzing GEX after the open to see where we might go by Friday’s close.
If you’re interested in accessing our tools and analytics, be sure to check out our website! More improvements coming in February!
If you’re interested in learning more about our strategy and approach, we address all of these topics in our Geek University course which is included in all memberships.
We recently posted a YouTube video, and we have many other short videos, so give our channel a look if you’re curious about recent market commentary and ideas as well as gamma (GEX) concepts explained.
Thanks for being part of our community and know that we invite your feedback!
The information provided by Geeks of Finance LLC is for educational purposes only and is not intended to be, nor should be construed as, an offer, recommendation or solicitation to buy or sell any security or instrument or to participate in any transaction or activity. Please view our Investment Adviser Disclaimer and Risk Disclosure.