
“Catalyst Week” 2024!
2024 Election Subscription Discount: You may be stressed about your preferred candidates’ prospects for winning the upcoming election in the USA, but don’t let that stress expand to your trading resources..Take advantage of our temporary $300 discount on our annual Portfolio Manager-tier subscription! Enter code ELECTION2024 at checkout to receive the $300 discount! Get access to ALL of our tickers, engage in our chat group with experienced traders, get access to our 5-hour educational course, and also our Trade Ideas channel for our Educational Portfolio! 2 OF THE ORIGINAL 5 SPOTS AVAILABLE
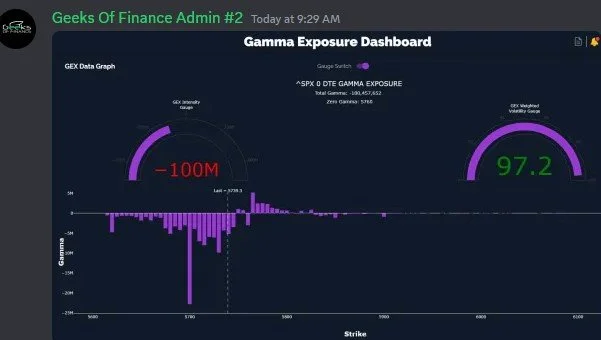
Despite the huge uncertainties and risks this week, we were given a great setup by our gamma (GEX) reading on SPX this morning, which was very one-sided in showing a negative GEX picture with 5700 as the target. We alerted our subscribers in our 0 DTE channel in Discord within the first hour of trading:
We just posted a brief YouTube video available to everyone where we cover some election-related topics as we head into the USA Presidential elections tomorrow, relating this event as well as the Fed’s rate decision and ISM/PMI data to current GEX readings that are all coming to us in the same week. Check it out if you get a chance by clicking here.
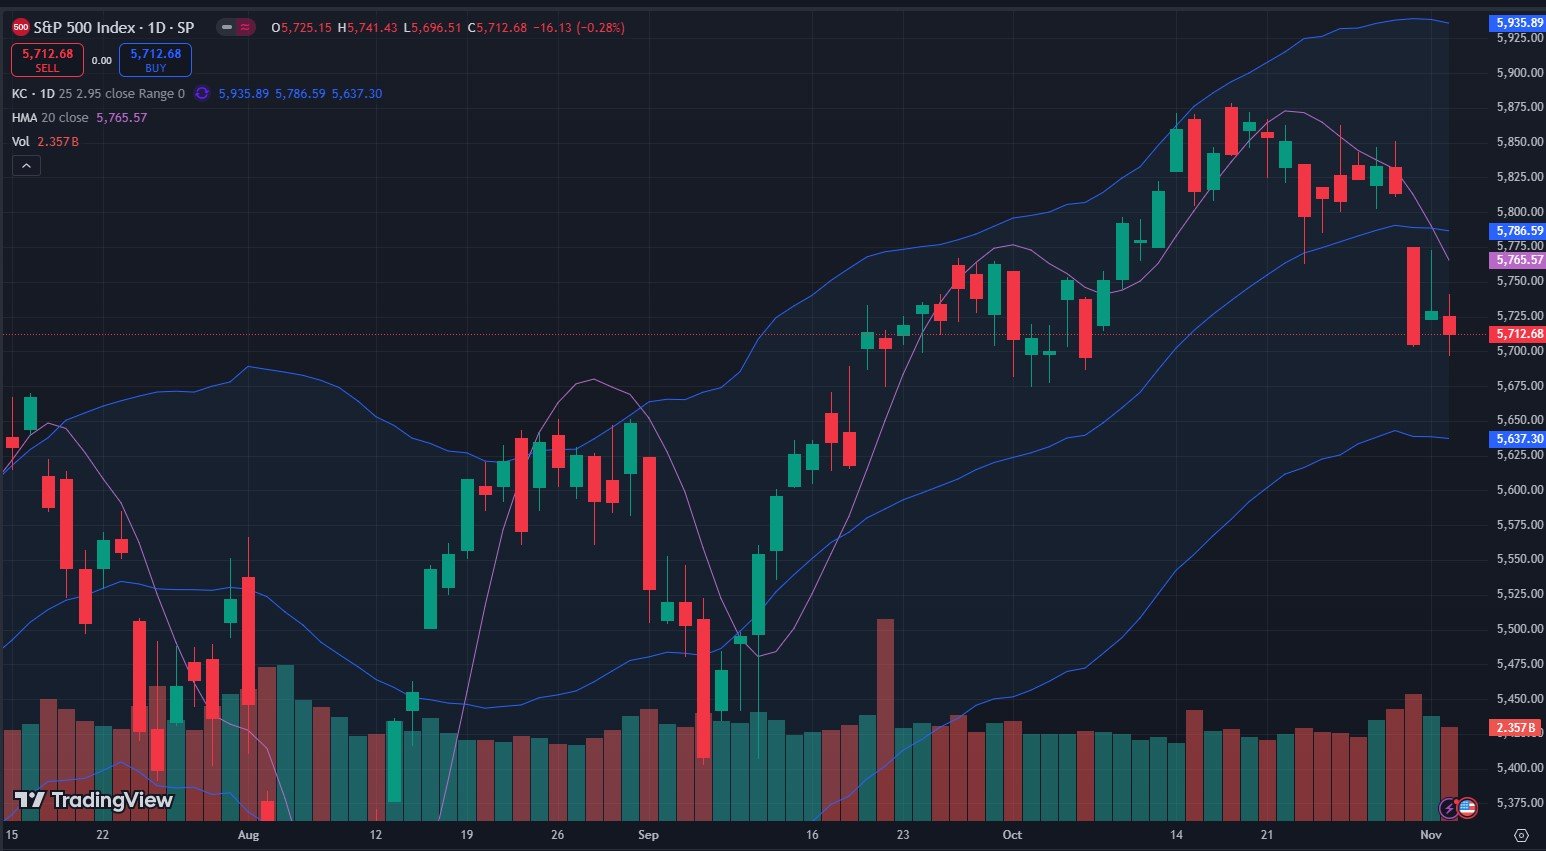
SPX has been pressuring lower ever since the gap below the Hull Moving Average last Thursday, with 5637 remaining as a potential target, the lower Keltner channel. The challenge with any target for any instrument during election week is that the target may be hit and completely reverse overnight, something we saw in both 2016 and 2020, for very recent examples.
Looking at the SPX GEX Levels below, you can see we are almost in the G2 Dealer Cluster Zone, but that box reaches down to almost 5600, matching our lower Keltner channel reading nicely. Confluence of two different data points doesn’t mean it happens, but I’d rather see unrelated points backing a similar conclusion, if possible.
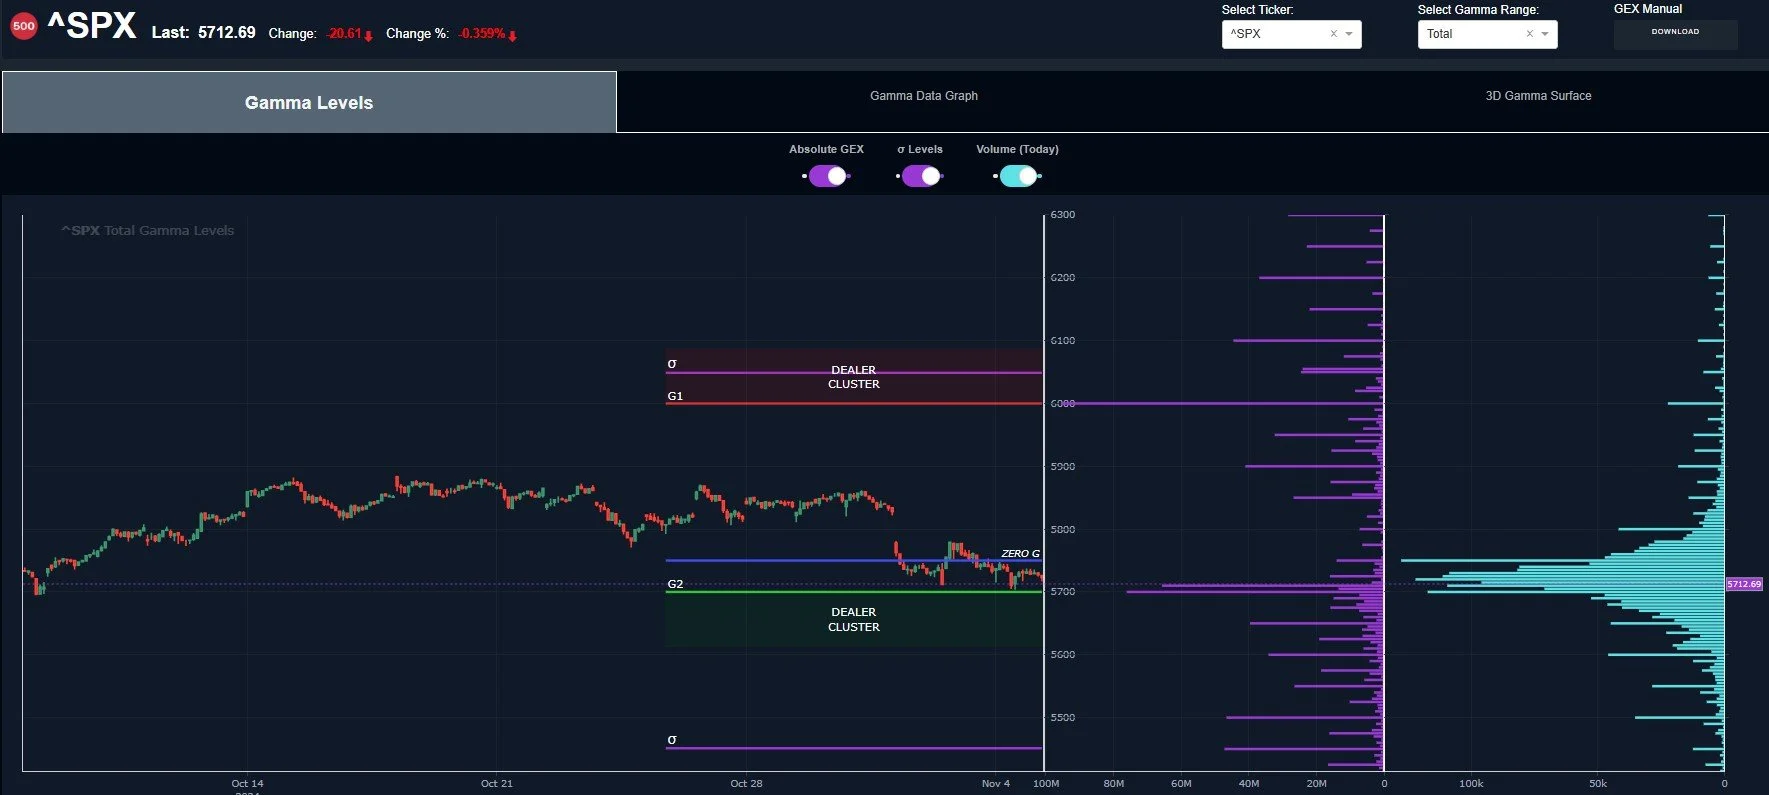
SPX GEX Levels: www.geeksoffinance.com
An interesting look at the specific GEX clusters at certain strikes: We have the largest negative cluster (outside of today’s expiry) at 5650 for tomorrow. The largest positive strike coming up is 5850 for a week from this Friday. Does this mean both of these happen? Not necessarily. We may see the GEX picture shift entirely by Wednesday morning, or even by tomorrow at the end of the day. But for now, the GEX picture suggests a possible market dip that extends a bit further, then a rally upon clarity being received regarding the new President after the election. Will we have clarity? The answer to that won’t be known until Wednesday.
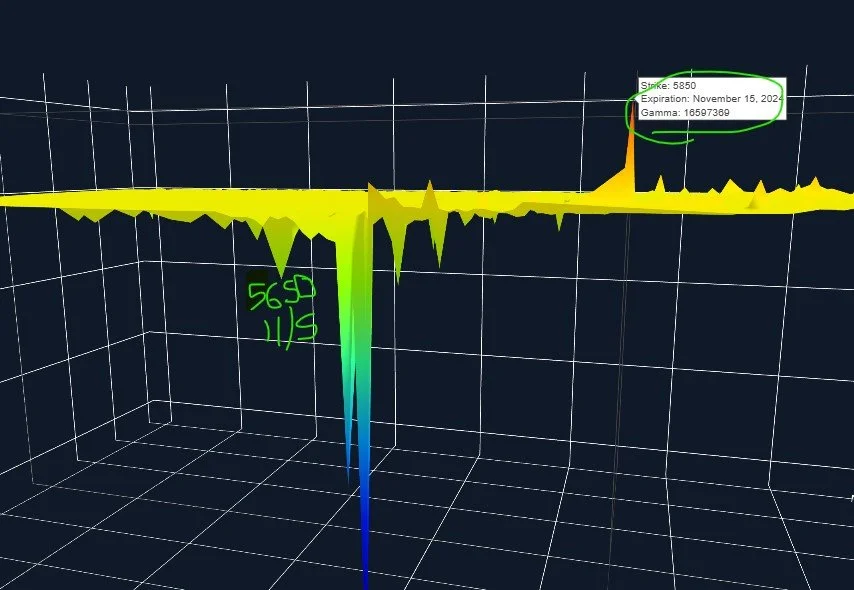
SPX 3D GEX: www.geeksoffinance.com
The VIX seems to suggest a similar picture: We see possible GEX resistance at the current area, and lots of volume below, but other factors point to a possible spike, which we’ll look at in a second (or as soon as you’re done looking at the chart below).

VIX GEX Levels: www.geeksoffinance.com
The VIX chart shows the 2-hour Keltners in a steep uptrend, very suggestive of a VIX spike to at least 23-24. In 2016 and 2020, we saw VIX spikes heading into election night, then a sharp VIX crush as we approached the early morning hours of the next day.

Zooming out from the 2-hour Keltner chart to the daily, we see room above, but a less enthusiastic picture for the VIX, though it’s still in an uptrend and we have 25-26 as a target on the daily chart. VIX 21 or higher preserves the outlook for higher VIX levels, meaning more volatility ahead. What we want to see is whether or not tomorrow night will see this target met and a subsequent reversal or if this will be the start of a larger downward move.

One more thing- let’s look at TSLA, which presumably will be a stock upon which to focus given Elon’s involvement with the Trump administration. His open policy with X.com and backing of Republicans may have made him one of the top targets of Democrats, which brings about potential political/legal liability, as seen recently with his issues in California. A Trump victory should (at a minimum) mean less legal expenses for Musk. What do we see when we look at TSLA GEX? Any clues from the option market?

Looking at the 3D GEX graph below, we see the biggest GEX cluster in the near term at 260 for this Friday. We have even more GEX at 300, but it’s clustered mostly on January 17, 2025. Very interesting, if this proves to be prescient in any way. Market positioning seems to currently suggest that TSLA is going to be ok going forward…We may know soon enough! Join us in Discord tomorrow for our discussions around what’s happening as the day progresses.
If you’re interested in accessing our tools and analytics or taking advantage of our promotion (see the top of this newsletter), be sure to check out our website.
If you’re interested in learning more about our strategy and approach, we address all of these topics in our Geek University course which is included in all memberships.
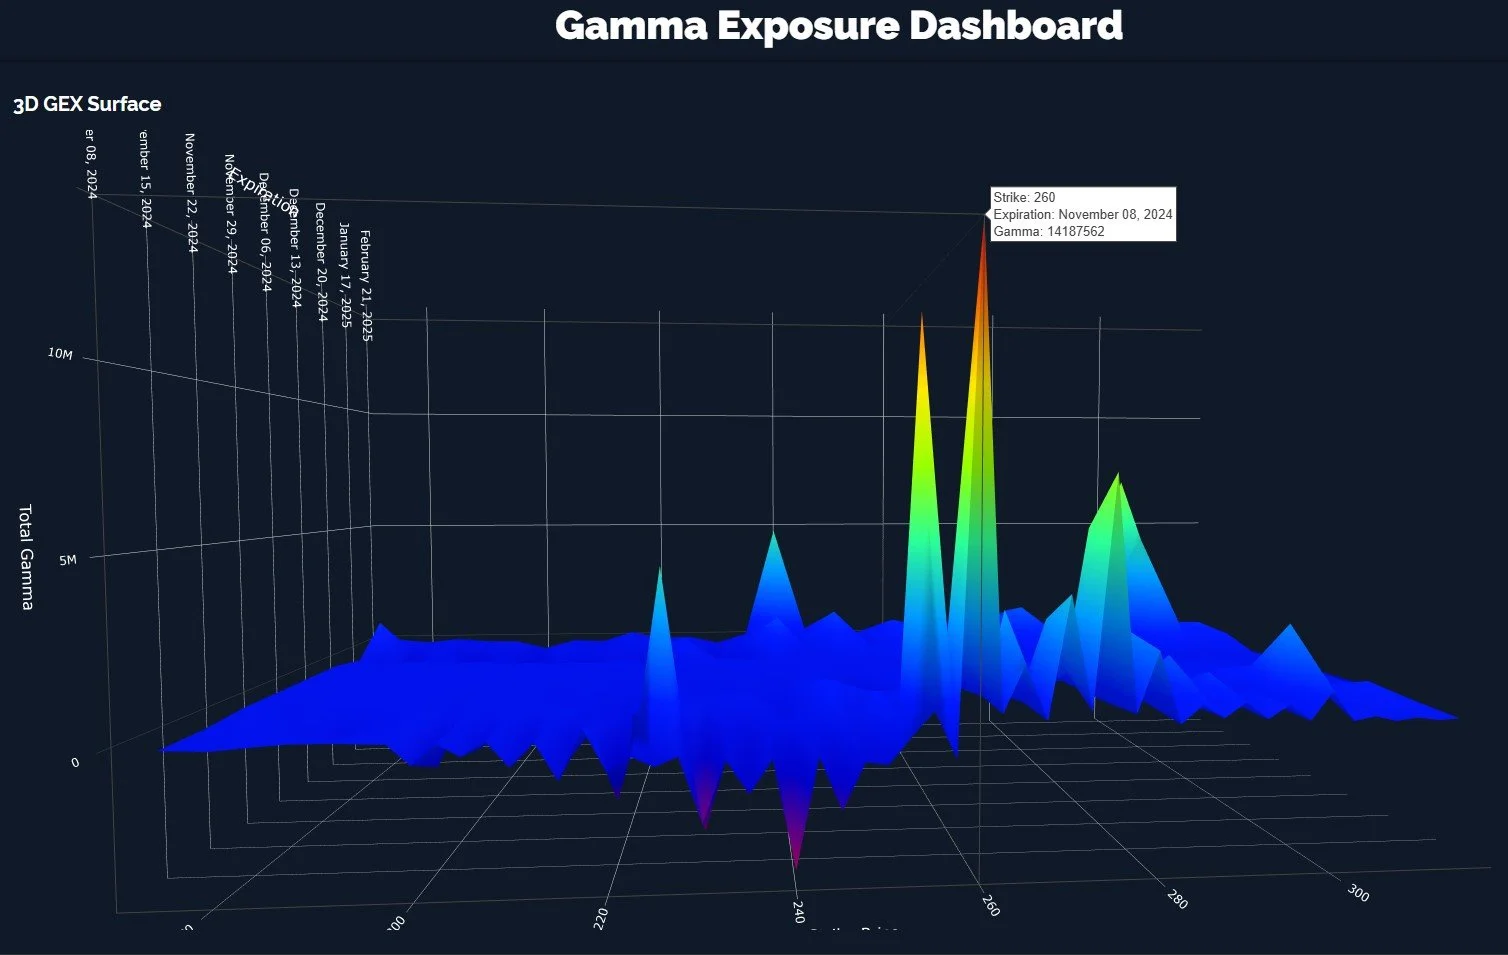
TSLA 3D GEX: www.geeksoffinance.com
Thanks for being part of our community and know that we invite your feedback!
We recently posted a YouTube video and we have many short videos for you to review where we cover a variety of predictions and educational topics.
The information provided by Geeks of Finance LLC is for educational purposes only and is not intended to be, nor should be construed as, an offer, recommendation or solicitation to buy or sell any security or instrument or to participate in any transaction or activity. Please view our Investment Adviser Disclaimer and Risk Disclosure.