
Overbought Heading Into OpEx?
November 2024 wouldn’t be the first time we’ve entered overbought territory as we approach monthly option expiration, but what does gamma (GEX) say about this week’s chance of ending the week positive or negative in terms of performance? As a reminder or introduction to our viewpoint, we emphasize GEX because GEX shows us how market participants are positioned in the options market, which goes beyond the theoretical scope of chart patterns. We’ve also observed GEX to give us an edge in a variety of situations. Check out today’s YouTube video where we discuss some key aspects of each main market index (SPX, IWM, DIA, QQQ) as well as a few individual tickers as well, like TSLA.
Last week, we pointed out that QQQ wasn’t showing a whole lot of interest at prices above 515. That hasn’t changed, and now that we’re above the upper Keltner channel, we also see a relatively “tame” candle without much ground gained above the upper Keltner as of Friday.

To back up the statement about not much interest existing above 515, we turn to our 3D GEX graph, which shows (beyond the largest clusters that expired Friday, which will disappear early in the morning) that 515 is the largest GEX cluster, a mere $1 away from current QQQ prices. 520 can be found on the graph, but in smaller quantity, and toward the end of December.
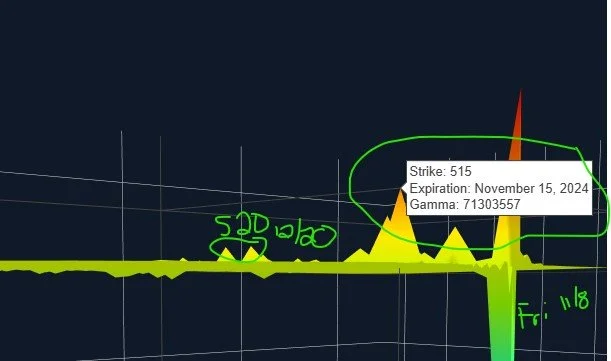
QQQ 3D GEX Graph: www.geeksoffinance.com
SPX also shows price entering the G1 Dealer Cluster Zone, a spot we’ve identified (using GEX) as a likely area for resistance or reversal.
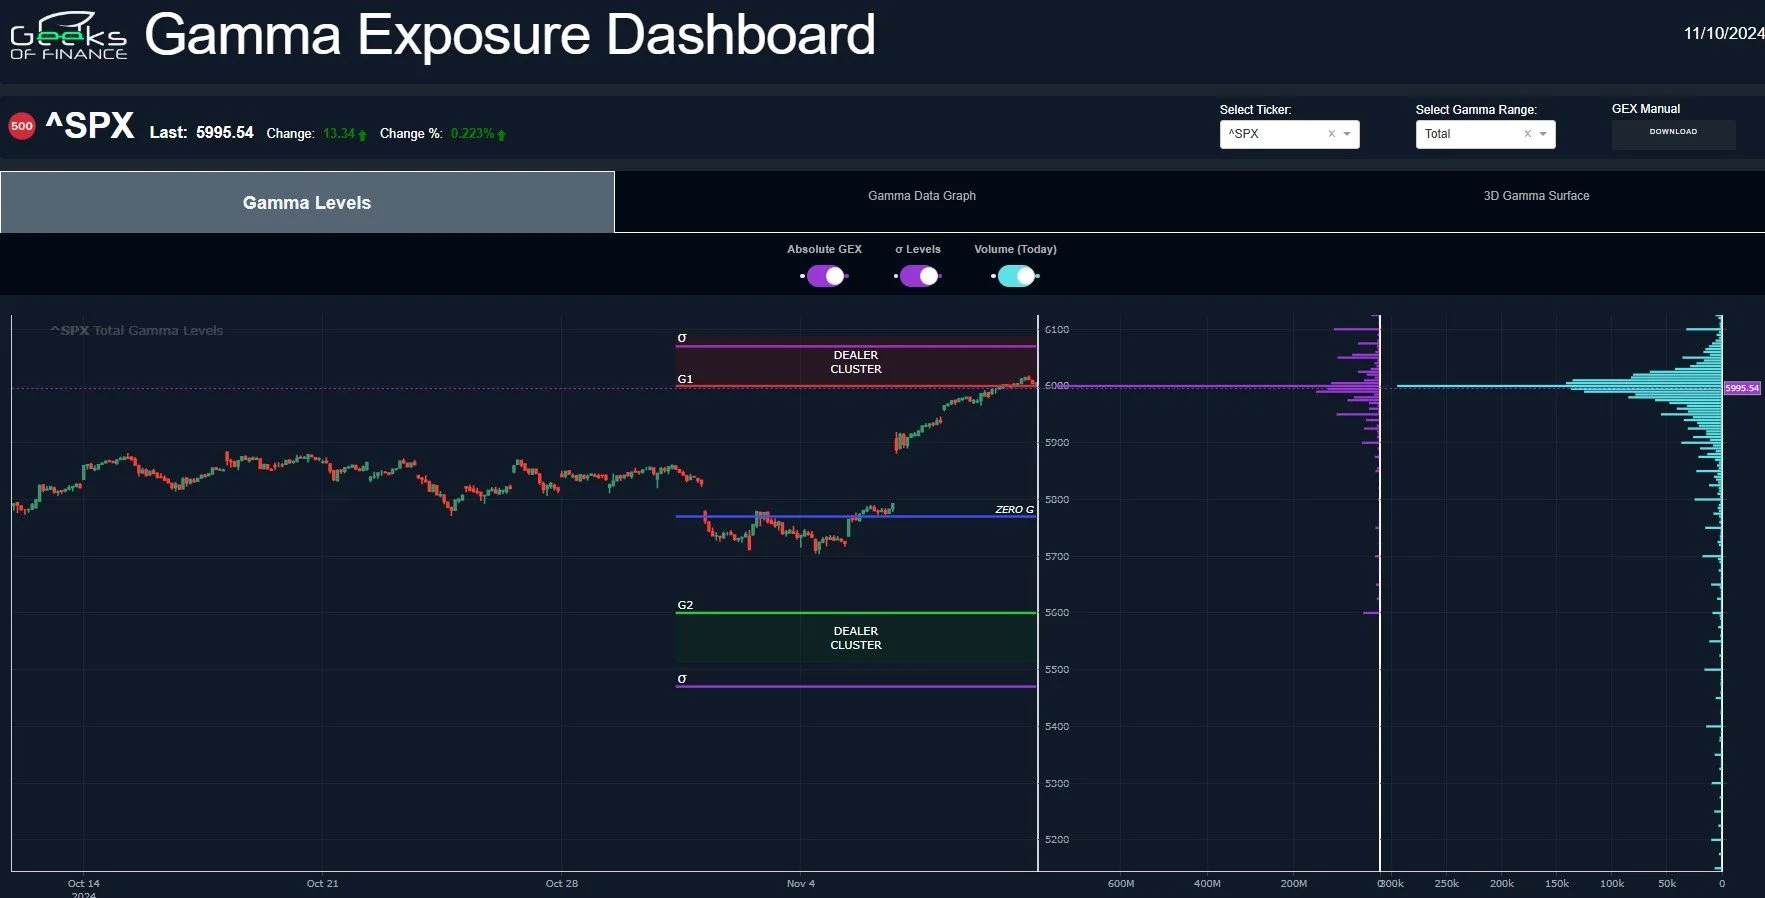
SPX GEX Levels: www.geeksoffinance.com
In the past, SPX reaching an extreme on the GEX Intensity Gauge (current GEX compared to previous GEX readings over the last 52-weeks) has also been prescient in predicting reversals, though timeframe is not specified in such a contrarian reading, merely that the odds are higher for a reversal at some point in the not-to-distant future.
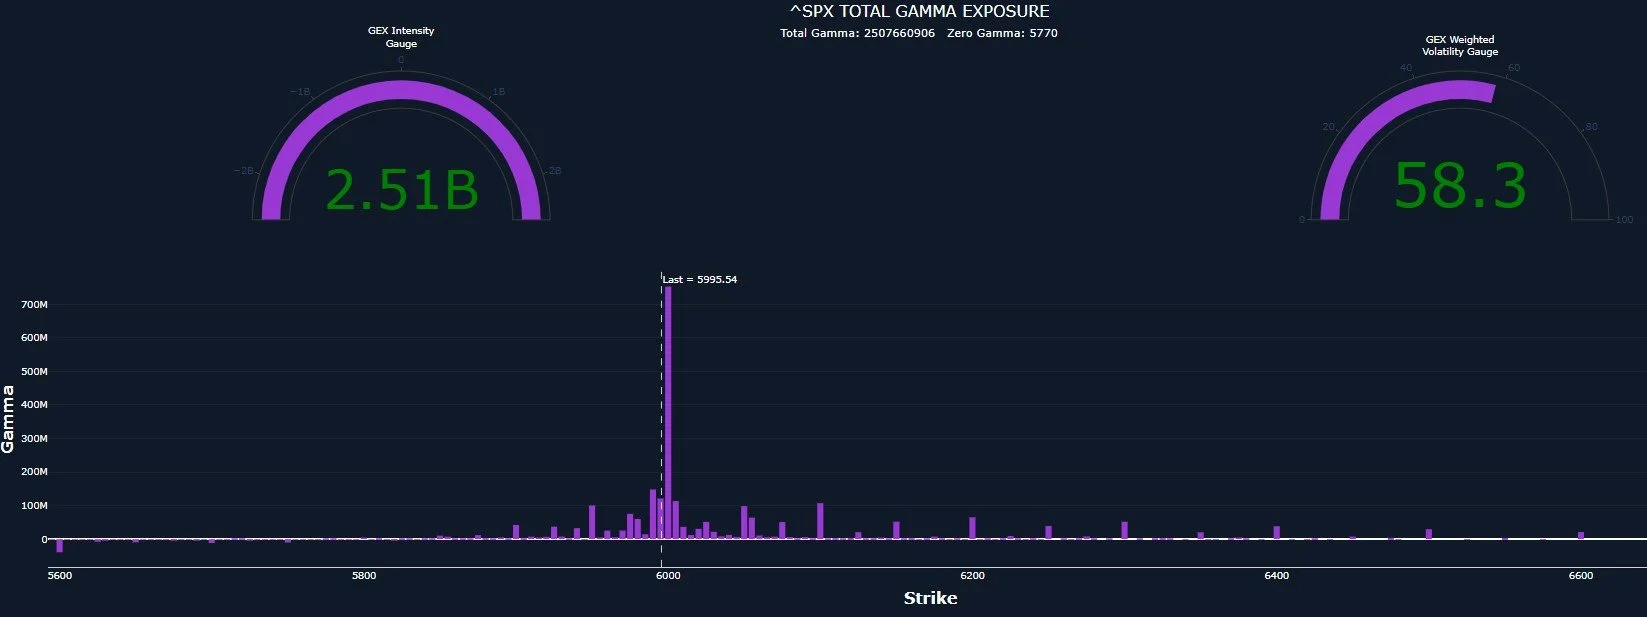
SPX GEX Graph: www.geeksoffinance.com
Some interesting observations from Friday in particular (pardon the multiple screenshots): The light blue line indicates volume for each strike, irrespective of direction. The third largest volume strike on Friday was at 5000 SPX.
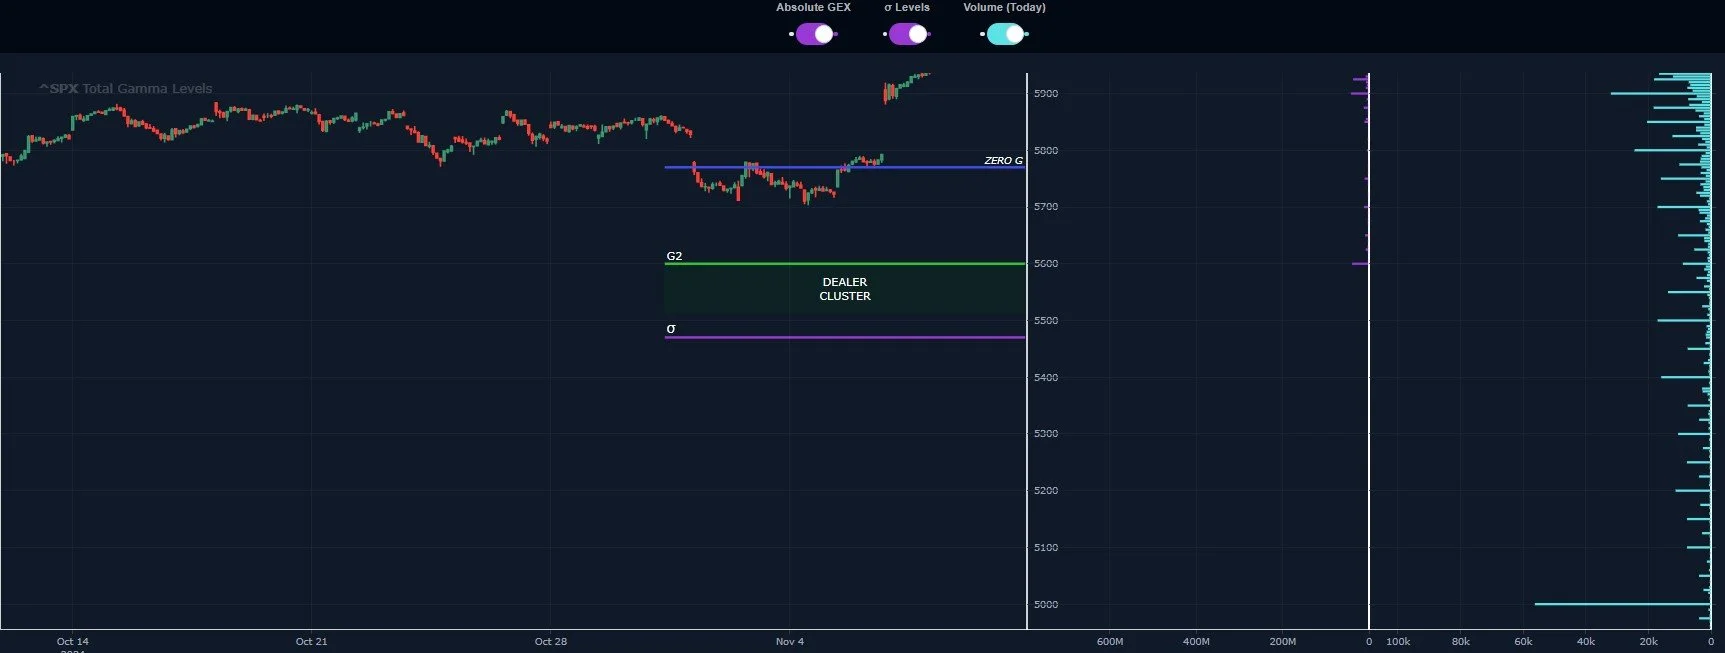
SPX GEX Levels: www.geeksoffinance.com
The 2nd largest strike (with the closing price Friday representing the largest strike, which is understandable) and larger than the 5000 strike was actually at SPX 4000. Quite interesting, given that we are tapping 6000 at the moment.
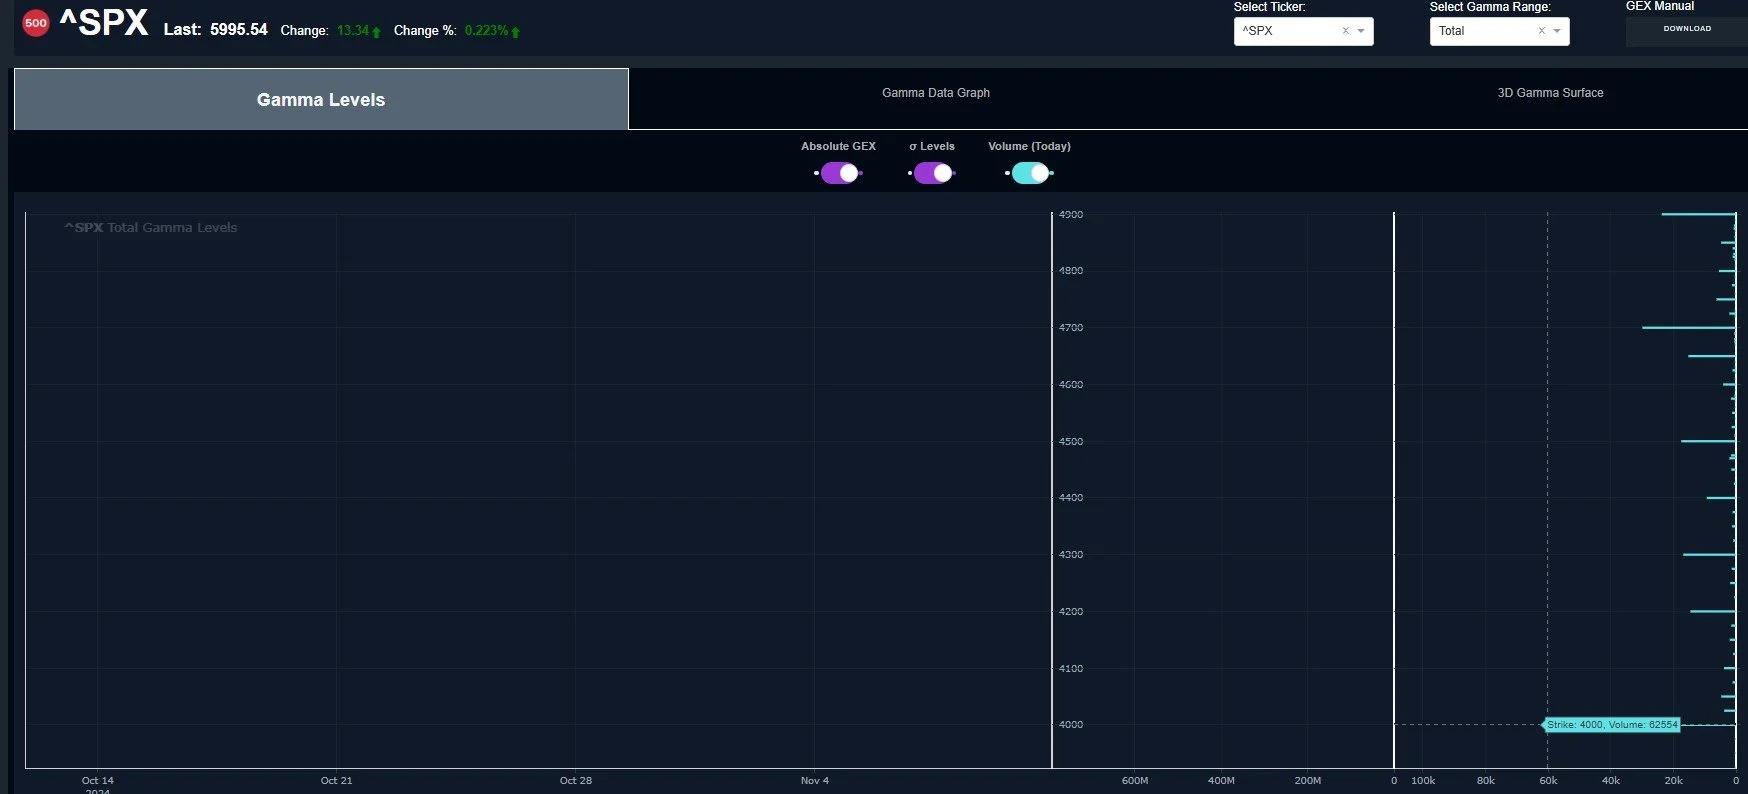
SPX GEX Levels Chart: www.geeksoffinance.com
We also need to note that the VIX is very close to the lower Keltner channel, with 14.47 VIX representing important support going back to VIX highs pre-July 2024 and VIX lows post-July 2024. Previous highs are now support levels for the VIX.

Now that you’re drawn out onto the ledge of bearish doom, let’s circle back to a couple of reasons why QQQ may not quite be done with the upside in the short term, namely AAPL and MSFT. QQQ is over the top of the daily Keltner channel, and we’ve mentioned that GEX is (at least for SPX, which shares 80% of the top holdings with QQQ) is near an extreme. But AAPL and MSFT show negative divergences, with price rejecting off of the middle Keltner for AAPL and retracing toward the middle Keltner for MSFT, never breaching the top channel. Both show positive GEX with the largest GEX clusters overhead. Does this make potentially negative divergences actually positive? Can these tails wag the dogs? I reckon it’s possible.

One last reference to the chart above, as long as AAPL holds the Hull around 223, I believe the bias is toward those higher levels. Looking at the chart below, 240 and 250 both show signficant GEX clusters. 240 puts the price in the upper Dealer Cluster (G1) Zone.

AAPL GEX Levels: www.geeksoffinance.com
MSFT has a fairly similar (if not more bullish) picture, having exceeded the Hull and the middle Keltner, but now appearing to head back toward a retest of the line. 419 holding opens the door to 440.
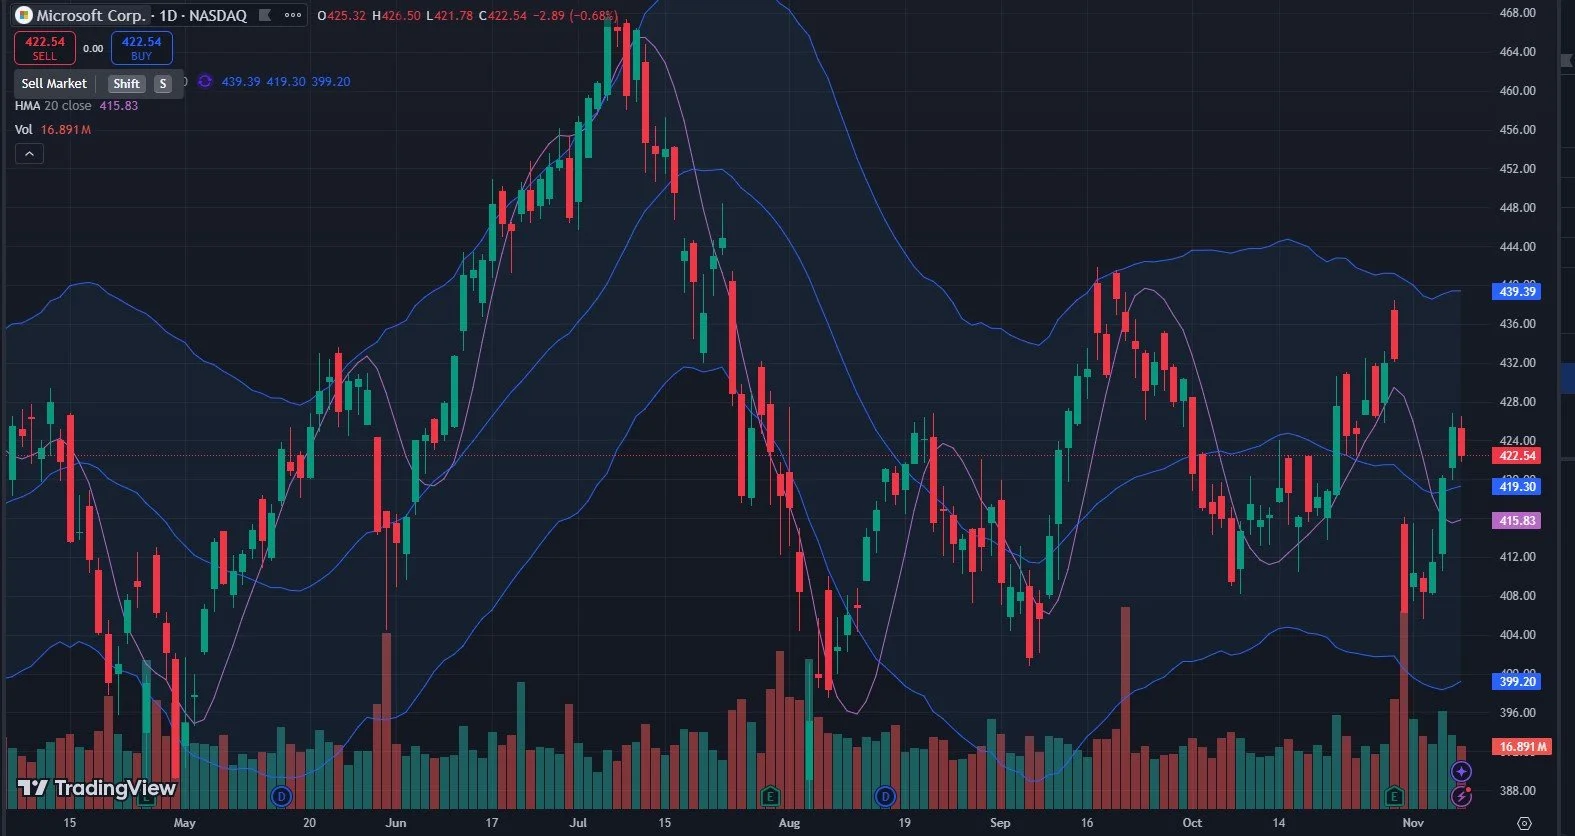
440 matches great with the upper G1 Dealer Cluster level for MSFT. 450 is even seeing some attention.

With OpEx Friday, and VIX expiration the following Wednesday morning (11/20), it’ll be interesting to see how this plays out. We see bearish signs, but we also have to give credit where it’s due. Join us in Discord tomorrow for our discussions around what’s happening as we close out the week!
If you’re interested in accessing our tools and analytics or taking advantage of our promotion (see the top of this newsletter), be sure to check out our website.
If you’re interested in learning more about our strategy and approach, we address all of these topics in our Geek University course which is included in all memberships.
Thanks for being part of our community and know that we invite your feedback!
We recently posted a YouTube video and we have many short videos for you to review where we cover a variety of predictions and educational topics.
The information provided by Geeks of Finance LLC is for educational purposes only and is not intended to be, nor should be construed as, an offer, recommendation or solicitation to buy or sell any security or instrument or to participate in any transaction or activity. Please view our Investment Adviser Disclaimer and Risk Disclosure.