
Slow Grind Higher
2024 BLACK FRIDAY SPECIAL! We just rolled out some EXCITING updates tonight and we want you to be part of it! Take advantage of our temporary $300 discount on our annual Portfolio Manager-tier subscription by entering code BLACKFRIDAY at checkout! We have 2 of the original 5 spots available for this limited time promotion.
Our primary scenario (though not the only scenario, just the highest probability scenario) that we mentioned a few days ago included an immediate, slow grind higher. With a little drama in between as SPX finally reached 6000, it appears initially that the market at least would like to see that grinding pathway higher until destination X (wherever that might be). With the VIX back at prior resistance-turned-support and SMH lagging, might we see a bigger pullback initially?
Today’s YouTube video is fairly short, but we cover some important aspects of SPX, BTC, follow-up on some previous ideas like TLT, and a quick look at AMZN.

The VIX chart above reflects the 4-hour Keltner channels, while yesterday’s chart reflects the 2-hour channel. The reason for the switch is because I notice the 2-hour channel has turned down, meaning the VIX could technically move lower along that lower boundary to much lower levels. By zooming out and looking at the 4-hour, daily, or weekly, I might be able to get a better idea of the next potential destination that may serve as a reversal area. With that idea in mind, I see that the 4-hour chart doesn’t look as bearish for volatility as the 2-hour, and in fact, the lower Keltner is only gently leaning lower while the upper channel is still elevated over 18.
Looking at today’s GEX Levels chart, we once again saw elevated volume at 18, with a possible dealer cluster at 20. This is what I’d expect to see if the VIX was going to stage some sort of rebound.

VIX GEX Levels: www.geeksoffinance.com
DIA and IWM have really been the indices to send the shorts into a disorderly retreat, with SPX also looking strong, but meanwhile, tech (and the semiconductors in particular) look relatively weak. However, this situation has created a divergence that might lead to some nice gains as QQQ plays catchup. 519 is almost 2% higher for QQQ, whereas SPX’s top Keltner is closer to a .25% gain for SPX. The other alternative, and of course, the million dollar question, is whether QQQ is currently serving as a forward warning signal that the bull is about to become steak or if it indeed has the catchup scenario in play.
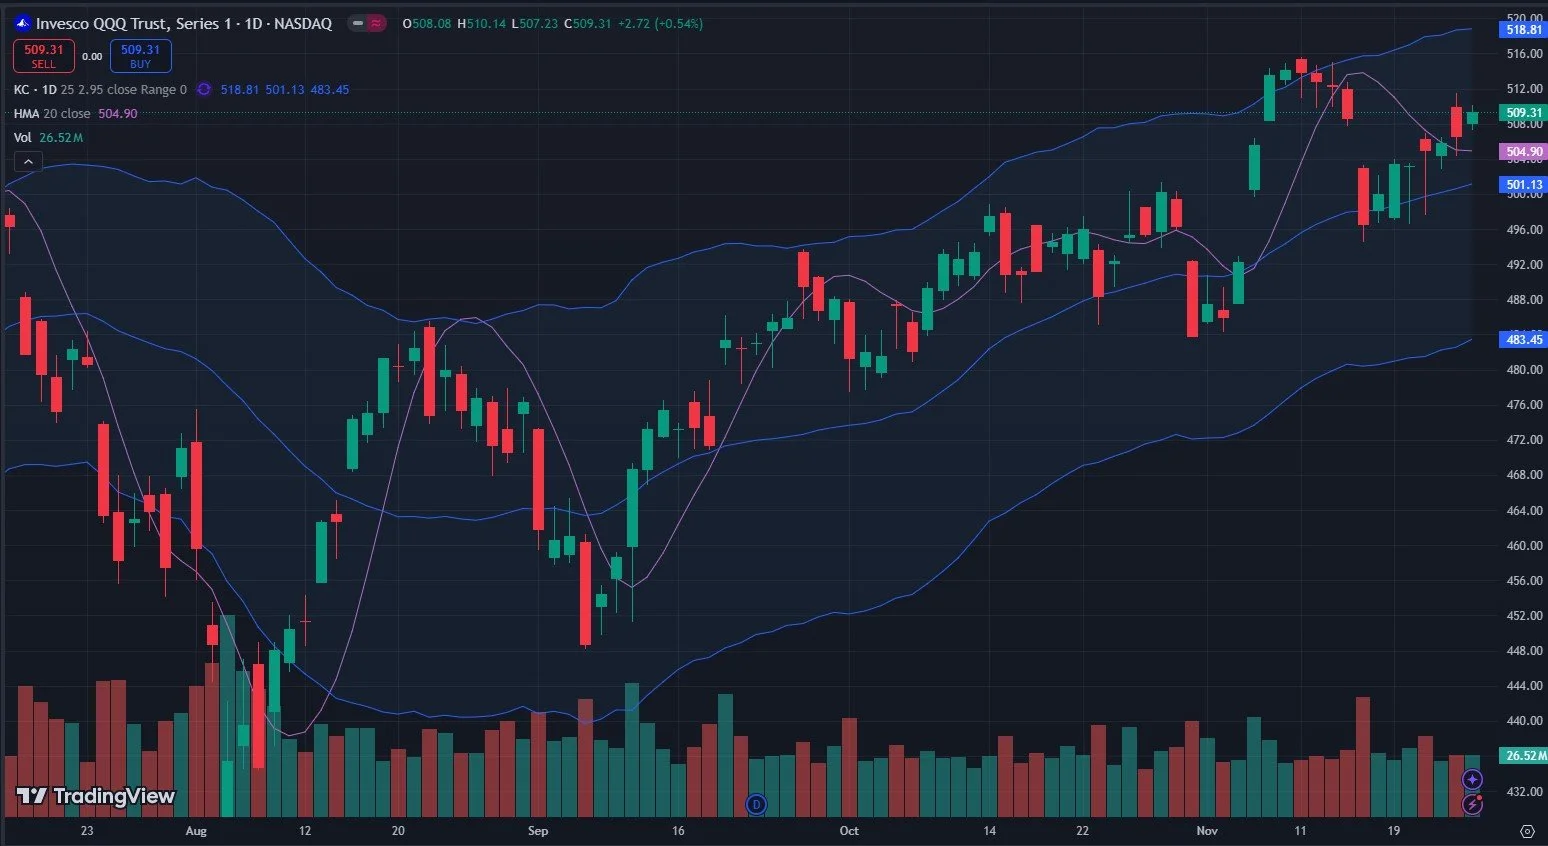
QQQ GEX has moved to a higher positive reading than any time recently. The GEX Intensity Gauge (not shown tonight) has plenty of room for GEX to climb before QQQ GEX would be considered to have reached an extreme level. This and the fact that QQQ is now above the Hull Moving Average for the 2nd day are bullish, in my opinion.
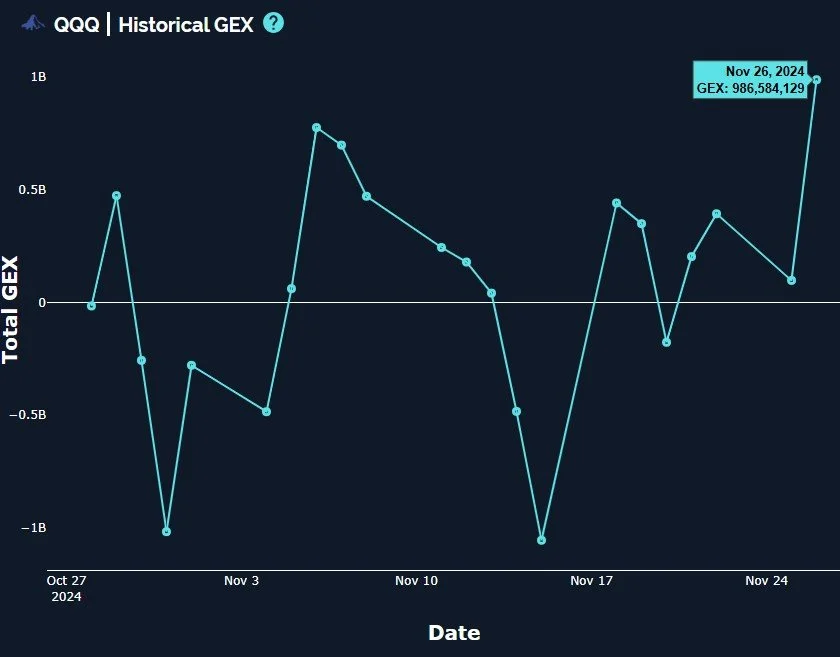
QQQ Historical GEX: www.geeksoffinance.com
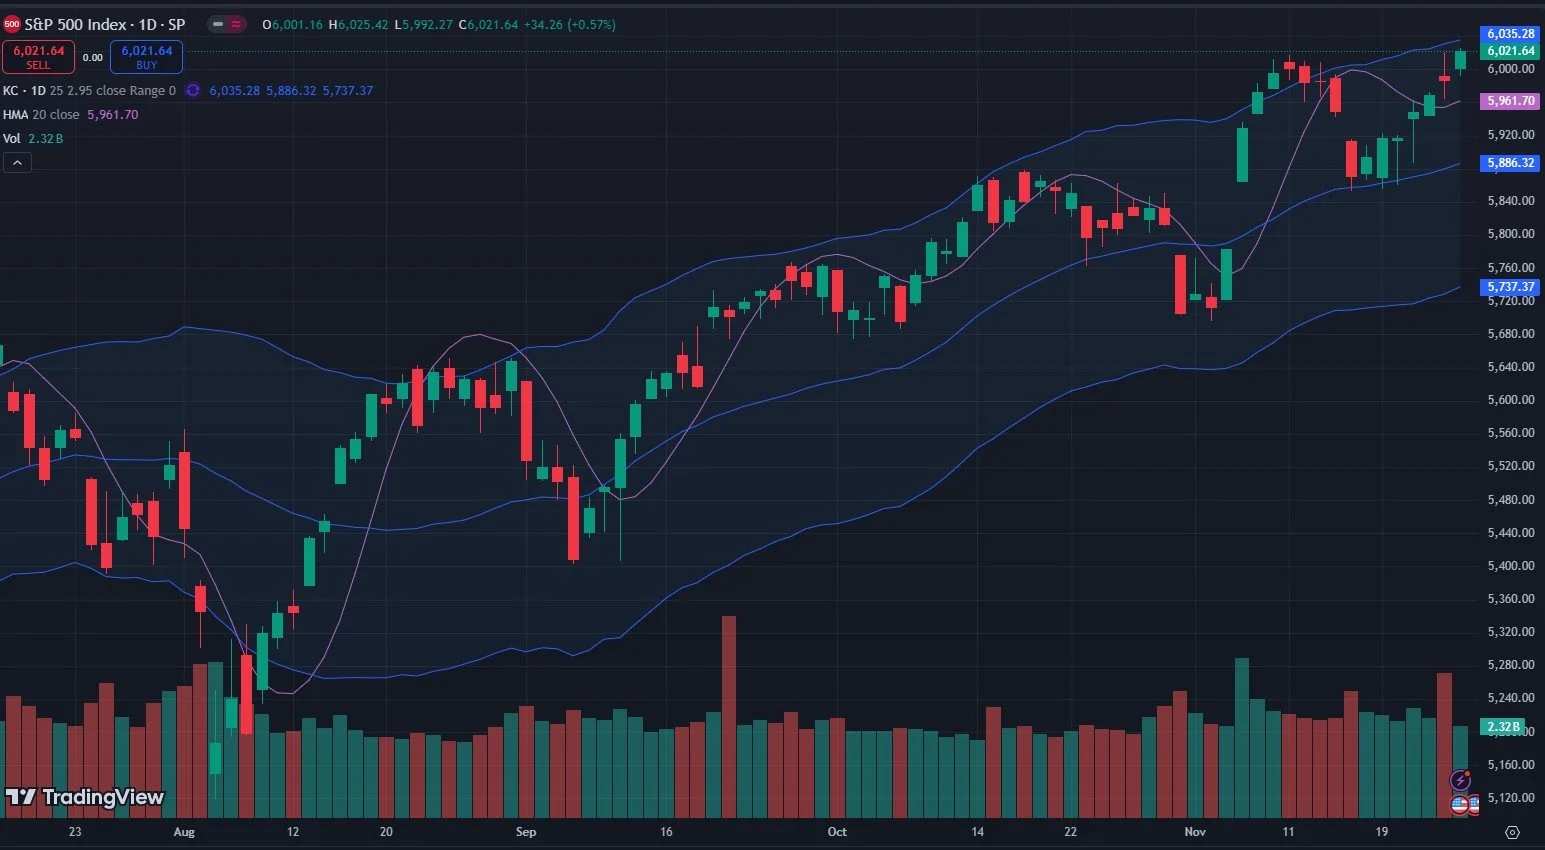
Speaking of SPX, you can see that the solid uptrend has indeed respected the top Keltner channel, exceeding it slightly for 1-4 days before sizable pullbacks have occurred. We are close to the top again, with about 14 points to go.
It’s incredible how bullish SPX has been most of the year. We are now seeing positive GEX shift even higher in a meaningful way, with 6100 growing and even 6200. This Friday’s expiry shows 6050 as a big focus. I picture a Wizard of Oz-type carnival worker standing behind a booth telling someone “she bottomed at 666 in 2009, she’ll top at 6666!” Ok, enough with my wild imagination.
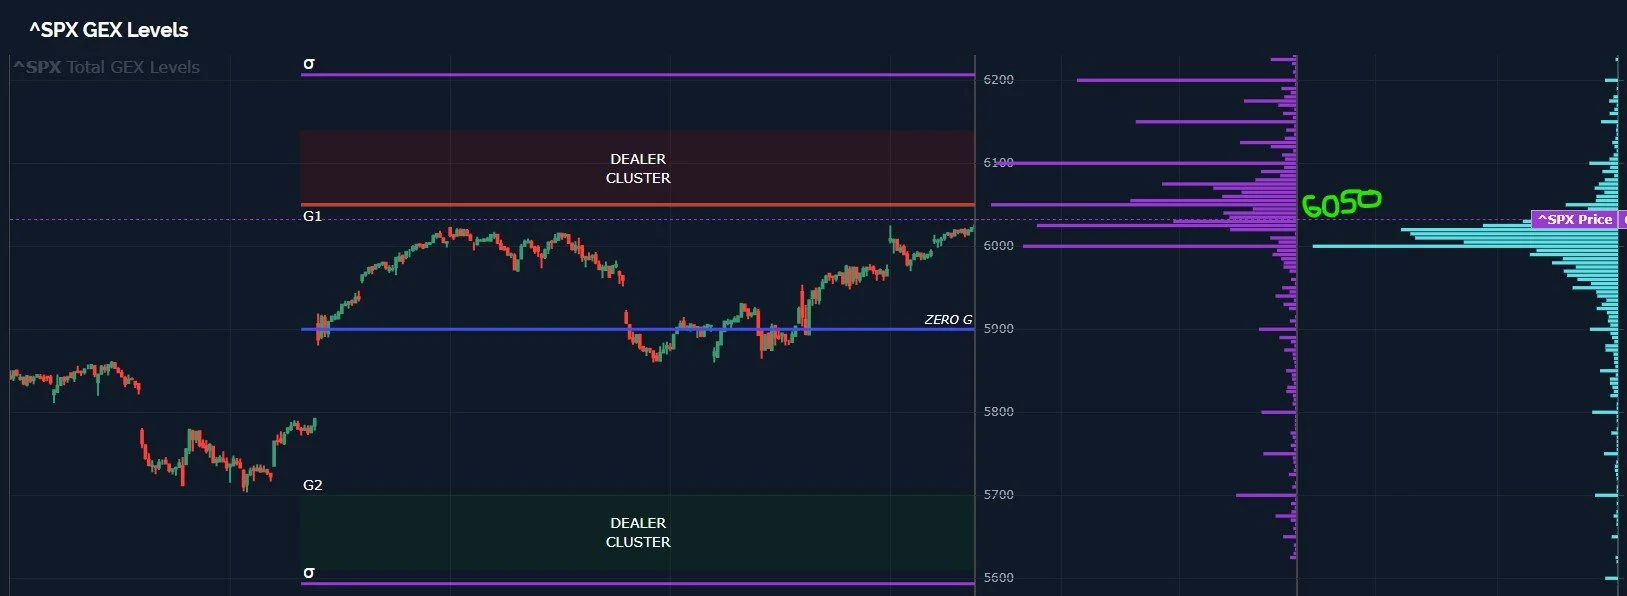
SPX GEX Levels: www.geeksoffinance.com
As far as SPX’s total net GEX goes, we’ve previously seen recent GEX tops around 2B-2.5B, though you can go back farther and find rare instances of GEX being even higher (or lower) at each extreme. Will we continue the GEX climb until we reach a similar area to prior highs?
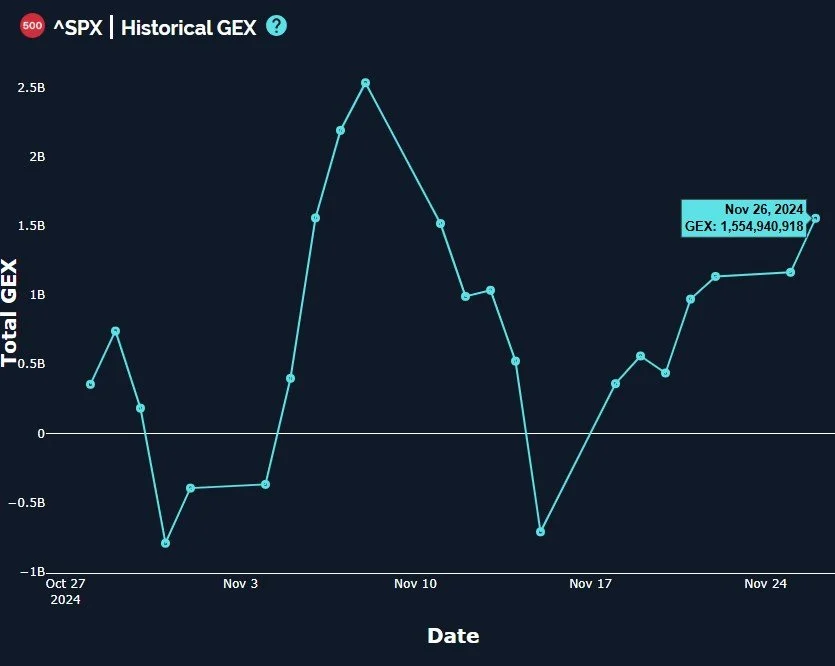
SPX Historical GEX: www.geeksoffinance.com
As I mentioned, 6050 is a major cluster for Friday on SPX. 6100 is now a big focal point approaching December 20. We still have window of potential weakness for a couple of weeks, so we’ll continue watching for further red flags on a day-by-day basis.
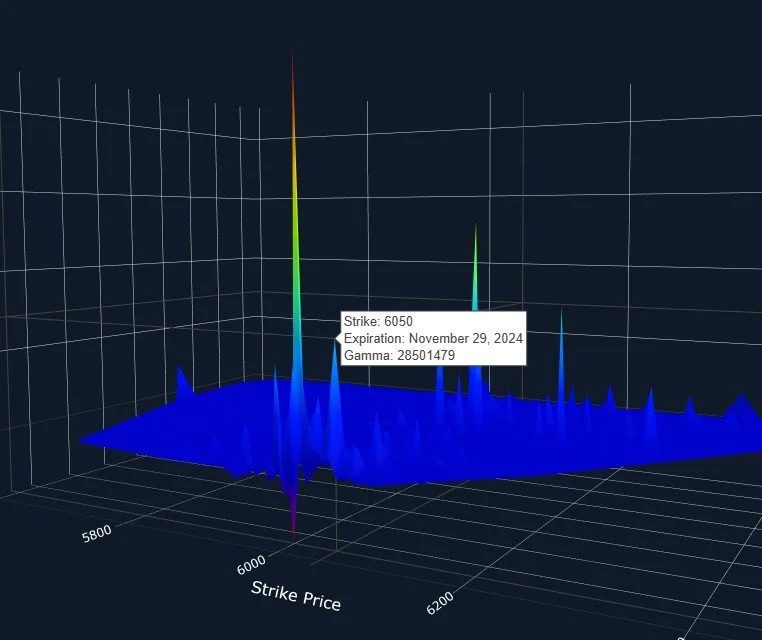
SPX 3D Graph: www.geeksoffinance.com
We have a continued bullish setup with SPX, and QQQ even looks bullish now, and we have higher GEX targets into year-end. We aren’t excited about buying at these levels, but any weakness might prove to be good buying opportunities as long as the GEX picture looks the way it does. If we are to get any volatility this week, Wednesday would be a good candidate, especially given the heavy set of data reports we’ll see released. And all of the big ones will arrive by 10 AM ET.

Econoday.com
Join us in Discord tomorrow for our discussions around what’s happening as the day progresses. With Thanksgiving just one day away, we might not see a lot of action, but we’ll at least be looking for GEX’s signals to pay for our turkeys (or tofurkeys), even if that means utilizing strategies that kill premium. We had several great successes in our PM channel today based on the message from GEX that we would likely stay collared in a range, for example.
If you’re interested in accessing our tools and analytics or taking advantage of our promotion (see the top of this newsletter), be sure to check out our website.
If you’re interested in learning more about our strategy and approach, we address all of these topics in our Geek University course which is included in all memberships.
We recently posted a YouTube video, and we have many other short videos, so give our channel a look if you’re curious about recent market commentary and ideas as well as gamma (GEX) concepts explained.
Thanks for being part of our community and know that we invite your feedback!
The information provided by Geeks of Finance LLC is for educational purposes only and is not intended to be, nor should be construed as, an offer, recommendation or solicitation to buy or sell any security or instrument or to participate in any transaction or activity. Please view our Investment Adviser Disclaimer and Risk Disclosure.