
Flirting With Key Resistance
2024 HOLIDAY SUBSCRIPTION SPECIAL- $300 off of the annual Portfolio Manager subscription! We JUST rolled out 500+ new stock and ETF tickers on the dashboard. Check it out for yourself! Enter code HOLIDAYS at checkout!
Friday’s rally to just above the Hull Moving Average on the daily chart is technically positive, though the proximity to another potential resistance spot at the middle Keltner channel overhead leaves the burden of proof to the bulls. Gamma (GEX) needs to grow at those higher option strikes to help pave a pathway for a continued rally. GEX continues to be very helpful to us on most days as far as intraday movement, so we’ll look for indications as to whether or not we’ll continue higher after the market opens Monday.
We just posted a YouTube video, focusing on a few major stocks like NVDA and TSLA as well as SPY and BTC, so we’ll complement the video analysis with additional commentary on QQQ today. Watch the short 8-minute video by clicking here.

The stopping point for QQQ’s rally Friday coincides with the middle Keltner channel on the 2-hour chart, so the stopping point was not without rhyme or reason. When one timeframe fails to show support or resistance for a move up or down, oftentimes we can find the relevant indicator level by looking across timeframes, which also may show which timeframe is currently indicating targets to the upside and downside. We’re still left with the same predicament of wondering whether or not this is a backtest before more downside versus the beginning of a larger move higher., and QQQ’s 2-hour Keltners are in a downtrend.

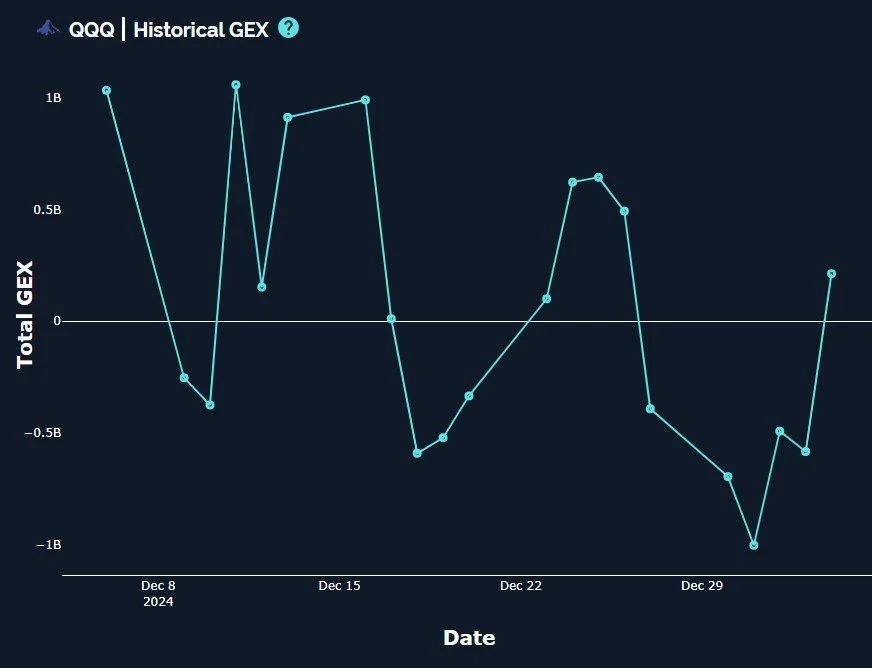
QQQ GEX moved just over the zero line into neutral/positive territory, same for SPX. This is also inconclusive, since we often see such rebounds in the midst of negative GEX environments, so we can’t conclude whether or not we are flipping bullish just yet. We’ve been writing about an imminent rebound, but we prefer to see a solid backdrop for the sake of the rebound sustaining, so let’s look a bit deeper into the GEX picture.
The biggest issue I see currently with QQQ’s (and SPX’s) GEX picture is a general weighting toward negative strikes still, excluding the huge positive GEX clustered around Friday’s close, which will roll off tomorrow morning given Friday’s expiration. This leaves the biggest single cluster for QQQ in negative territory at the 500 strike. While we do see some positive GEX at 530 and 535, 500 and 505 GEX clusters are larger, so we need to keep an eye on the risk of another drop. Recall that as of last week, QQQ was the only index to not yet reach its lower Keltner channel..So my suspicions of unfinished business remain. We expect to see higher strikes grow if the markets intentions are to sustain a longer rally, which we do expect to occur whether now or after another drop.

The shifting of the Dealer Cluster zones shows QQQ to be in an area where dealers may become sellers, though this box does stretch upward some, giving room for further potential upside before downside, though this is not a requirement to see downside from here. The middle Keltner is at 521, which would also imply a slightly higher target initially. As mentioned on the YouTube video, if we continue the rally, these dealer cluster zones will likely move higher as well as the option market shifts.

Looking at the VIX below, some timeframes show the VIX to already be at a key support level for volatility, though I am sharing the 2-hour Keltners to point out a potential lower target, in the event the rally continues. Such a move may place the VIX close to 15 again, an important level going back in recent history. Nothing immediately seems to signal that the VIX is ready to head back to 12 anytime soon, and the volume we saw Friday was quite interesting, as you’ll see below.

About that volume Friday (the light blue horizontal bars): All of the major volume outside of the spot price (and a couple of points around that) were higher. Way higher. VIX 50 saw 71.3k contracts traded, the highest volume of the day. This could be major players simply wanting to hedge, it’s a speculative thought process without any firm answers immediately, but it’s certainly unusual to see such activity at way higher strikes on the VIX. Current GEX positioning still signals 20 as an upper Dealer Cluster zone.

Lastly, let’s take a look at Bitcoin (BTC), also discussed in the YouTube video, just to throw a different perspective out there. The Keltners overall are sideways/neutral, but with price above the Hull, I view it with a bias toward the long side.

Not only do we see large GEX at 100k still, we also see 110k and 120k with meaningful GEX clusters.

BTC GEX recently moved higher as well, which is bullish in our view, at least short term. Even when we saw GEX top out in the recent past, we often saw price continue moving higher a few more days. We don’t yet know if GEX has even topped out here, we’ll be watching to see what happens at 100k.

To conclude, we’ve noted the oversold nature of indices recently, and we’ve been looking for a bounce or multi-day rally. It’s too early to say whether or not this is “it,” so we’ll be continuing to watch dynamic changes in GEX as we reach these resistance areas such as Friday’s closing levels. We still see a potential floor a little lower than where we are (500 QQQ, for example), so if we do see more downside, we know where we might be stepping in with long biased trades (assuming GEX continues justifying those levels). Join us in Discord tomorrow and we’ll share what we’re seeing early in the day. The first full week of trading for the new year is upon us, so let’s make the most of it!
If you’re interested in accessing our tools and analytics, be sure to check out our website. We just rolled out 500 new tickers and speed enhancements!
If you’re interested in learning more about our strategy and approach, we address all of these topics in our Geek University course which is included in all memberships.
We recently posted a YouTube video, and we have many other short videos, so give our channel a look if you’re curious about recent market commentary and ideas as well as gamma (GEX) concepts explained.
Thanks for being part of our community and know that we invite your feedback!
The information provided by Geeks of Finance LLC is for educational purposes only and is not intended to be, nor should be construed as, an offer, recommendation or solicitation to buy or sell any security or instrument or to participate in any transaction or activity. Please view our Investment Adviser Disclaimer and Risk Disclosure.