
A Bullish Shift For SPX?
2025 WINTER SUBSCRIPTION SPECIAL- $300 off of the annual Portfolio Manager subscription! We’re on the brink of rolling out even more new features, including backtested algos for our subscribers to use, so we hope you’ll join us for the ongoing improvement of our total offerings! Enter code WINTER2025 at checkout! 2 of our 7 available discounted subscriptions are still available until Friday!
While SPX didn’t make another post-Monday gap down high today, it still printed a higher low in a range that is relatively tame compared to some FOMC days. After hours earnings reports have resulted in mixed market reactions, with tickers like META finally tagging our anticipated $700 level while MSFT faltered. Jobless claims and GDP data pre-market Thursday add to the uncertainty surrounding tomorrow’s open, which is really anyone’s guess at this point. Tonight’s newsletter will be more brief than usual, but we also discuss current developments in today’s YouTube video, which you can watch by clicking here, so check it out.
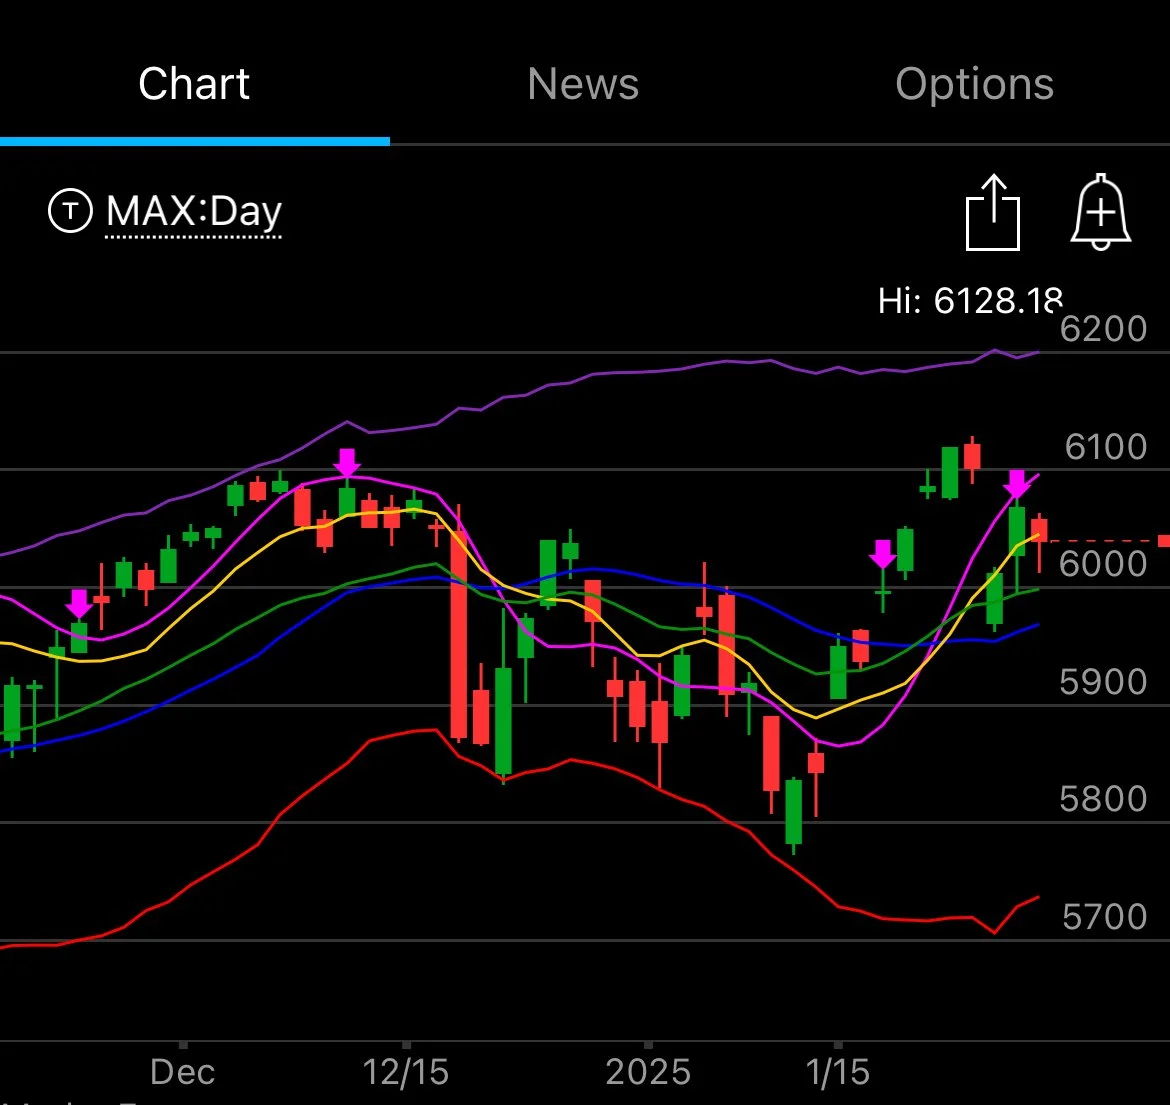
ThinkOrSwim Mobile Chart
My stance toward the Hull moving average (the pink line in the chart above) is that remaining below the line is bearish until proven otherwise, and today didn’t even make it up to yesterday’s highs. The 0 DTE gamma (GEX) picture at several times Wednesday was reflecting the possibility of an effort toward 6100, but that quickly diminished after the rate announcement at 2PM ET. The Hull is now at 6100, coinciding with meaningful positive GEX that remains at 6100, suggesting that 6100 is still a target with good odds.
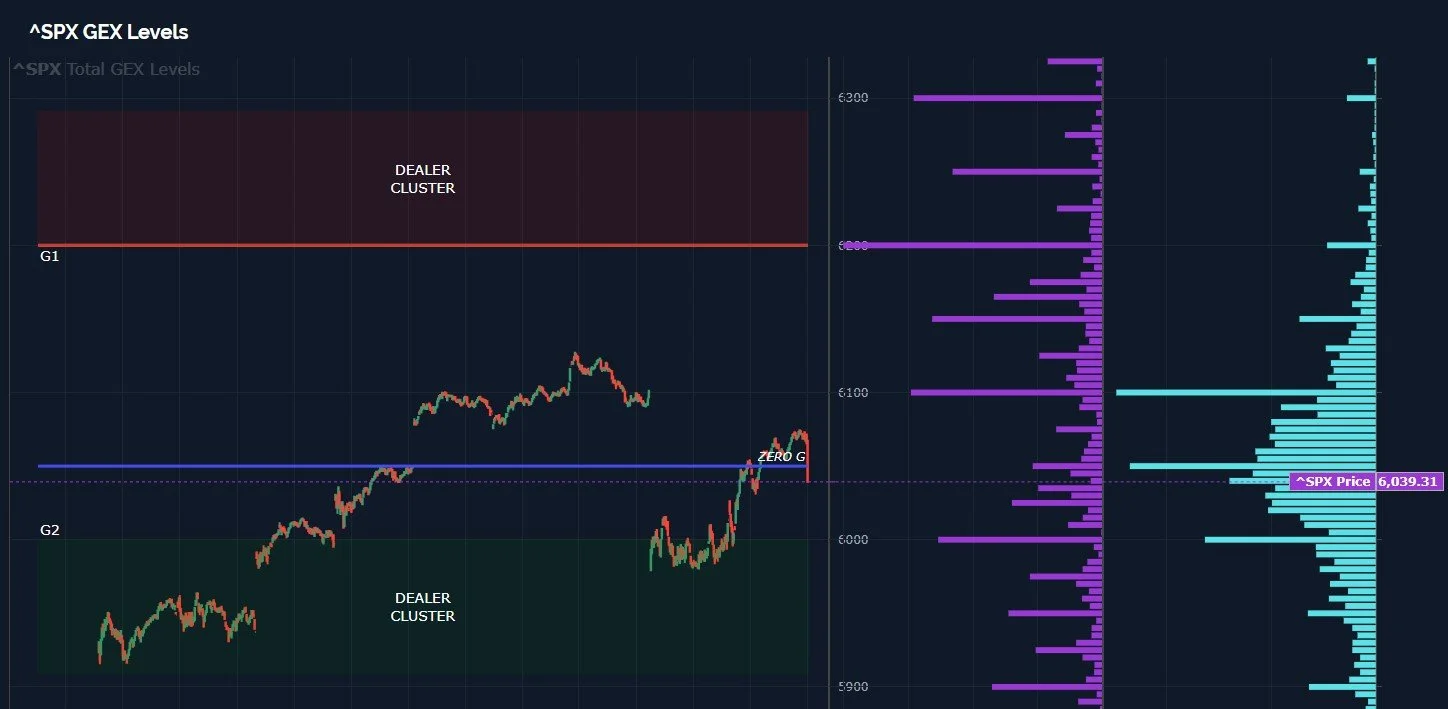
The GEX levels chart above shows a bullish shift in SPX GEX toward 6200 and even 6300. Total GEX is positive, and 6200 is the current largest individual GEX cluster for SPX, with most expirations sitting between January 31 and February 21. Our GEX dealer cluster zones are dynamic, and they adjust throughout the day as GEX shifts, so I tend to give more credit toward readings immediately after the close of the cash session (also reflected on our Historical GEX Graph).
A retest of the Hull at 6100 seems likely, based on the current picture, and therefore the largest GEX target at 6200 also has good odds. Note that 6200 is the top of the Keltner channel on the first chart posted, so the chart plus GEX both seem to project a breach of the Hull and continuation toward new highs. Let’s now glance at QQQ.

QQQ has been weaker than SPX or DIA, which is either an omen or potentially an opportunity to see QQQ reach the same indicator targets, with 527 representing the Hull and approximately 540 representing the top Keltner channel. The GEX picture isn’t nearly as optimistic as SPX, but the upper Dealer Cluster zone does cover the 527 level that represents the Hull.

In general, indices have seen a strong bounce, and the picture has shifted to support potential continuation of the rally. The next big test will be an actual test of the Hull from below, with a close above that line potentially signaling continuation to the top Keltner channel. With Friday being the end of January, a potential picture emerges of a January with a mid-month low and a month end that at least makes January positive, disappointing all of the “as goes January, so goes the year!” bearish crowd. Not to say that the market will be positive this year based on January, but the bears will be disappointed.

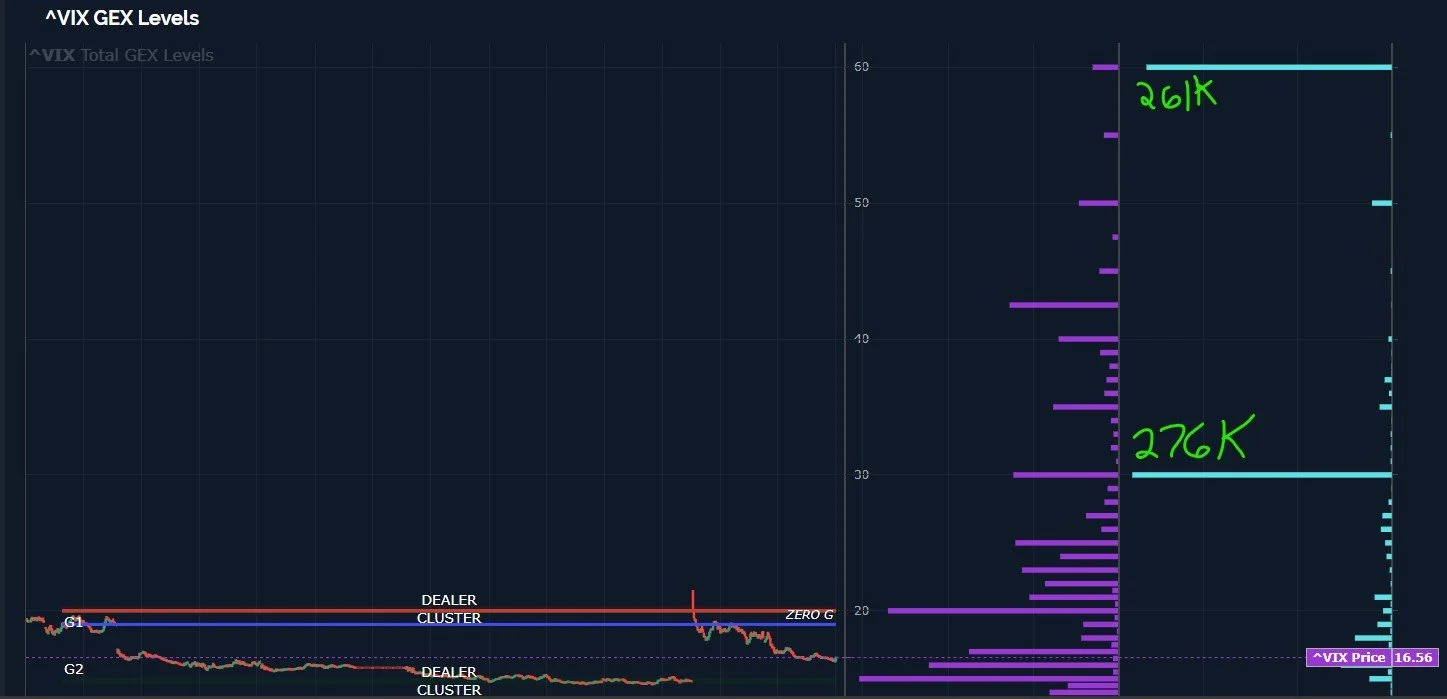
The VIX still gives bears some hope, holding above the Hull despite being crushed from highs every day since the Monday spike. The VIX chart shows 23 as the upper Keltner channel, and today saw highly unusual volume at the 30 and 60 strikes. In fact, at one point before FOMC, we noted that no meaningful volume had really occurred in the VIX at higher strikes, but by the end of the day, we can see the huge trades at 30 and 60.
We’re faced with a paradox: an uncertain picture with the VIX, which looks potentially more bullish for volatility than in quite some time, yet SPX shows a compelling picture for higher prices. This may be a matter of timeframe, where both are true, but one may require more patience than the other. We don’t like having to do a lot of guessing or gambling, so the current environment may be best served by giving careful thought toward how you can asymmetrically set up both long and hedge (short) positions, which is what we aim to do every day in our Educational Portfolio. With earnings season ongoing, any weakness tomorrow (or strength) still has the opportunity to be kept at bay with the after hours reports from AAPL, so stay open minded!

Earnings Whispers
Here’s the Discord link if you haven’t joined us yet. Access is free for some channels, and new members have a 7-day trial to see how we operate.
If you’re interested in accessing our tools and analytics, be sure to check out our website. We just rolled out 500 new tickers and speed enhancements!
If you’re interested in learning more about our strategy and approach, we address all of these topics in our Geek University course which is included in all memberships.
We recently posted a YouTube video, and we have many other short videos, so give our channel a look if you’re curious about recent market commentary and ideas as well as gamma (GEX) concepts explained.
Thanks for being part of our community and know that we invite your feedback!
The information provided by Geeks of Finance LLC is for educational purposes only and is not intended to be, nor should be construed as, an offer, recommendation or solicitation to buy or sell any security or instrument or to participate in any transaction or activity. Please view our Investment Adviser Disclaimer and Risk Disclosure.