
“Markets In Turmoil?”
2025 WINTER SUBSCRIPTION SPECIAL- $300 off of the annual Portfolio Manager subscription! We’re on the brink of rolling out even more new features, including backtested algos for our subscribers to use, so we hope you’ll join us for the ongoing improvement of our total offerings! Enter code WINTER2025 at checkout! Limited number of subscriptions available at the discounted price!
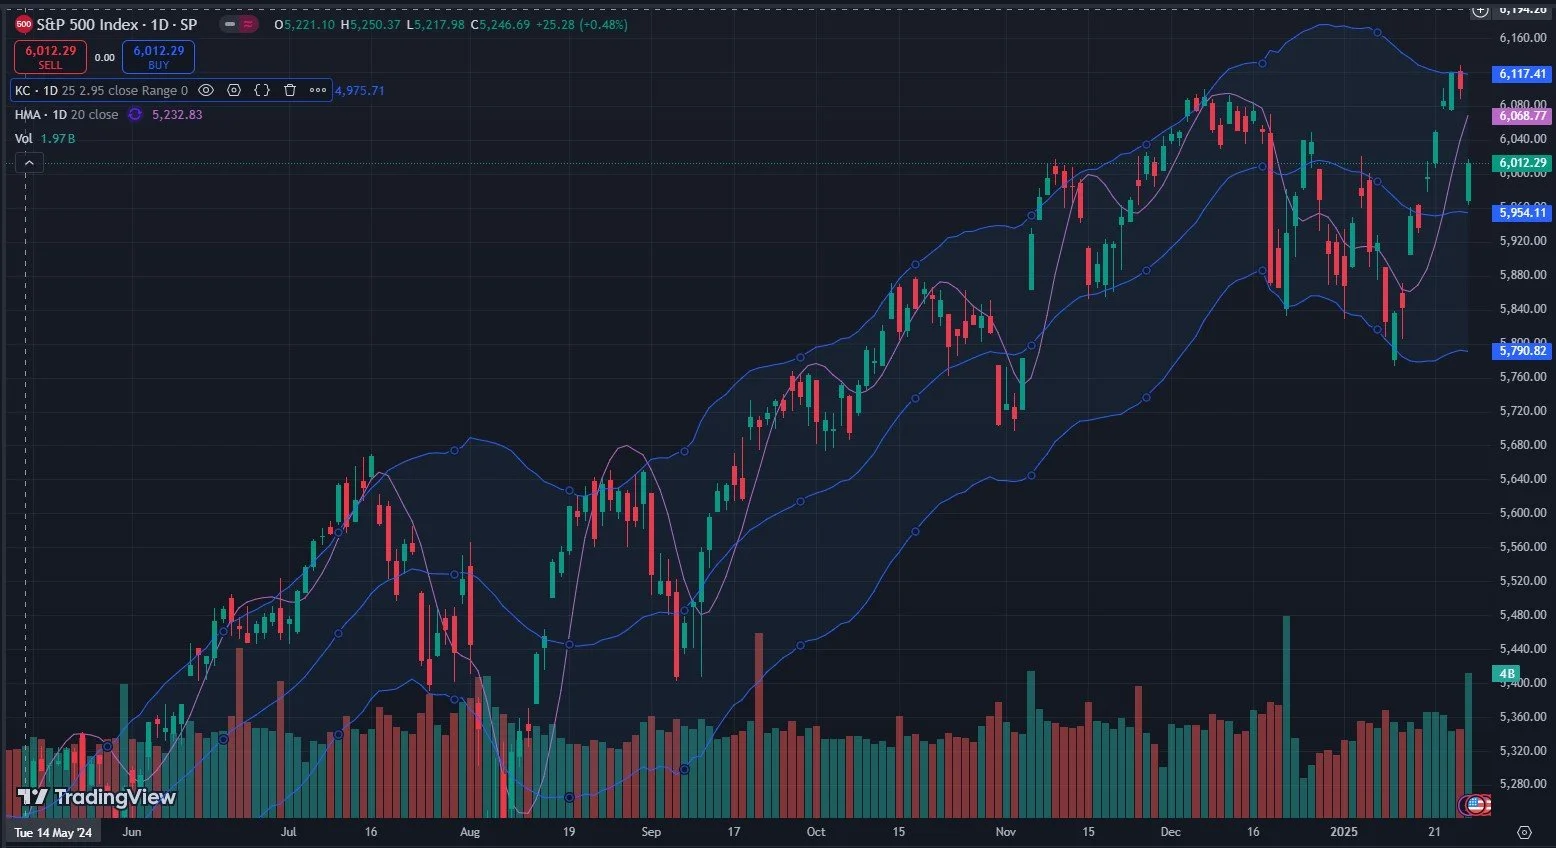
Who doesn’t love a good CNBC “MARKETS IN TURMOIL” headline, one of the best counter indicators in recent history? I didn’t see one today, probably because I gave up reliance upon news headlines for trading signals long ago (though a “mean tweet” buying or selling opportunity is sometimes enjoyable) and therefore wasn’t tuned in, but such a headline still may await us. SPX actually painted one of the largest green candles of the year today, from a gap down of course, and the VIX was kept at bay, dropping all the way back to the 17s from a high of 22.51.
If the pavlovian response is immediate dip buying on the first big gap down, is that really a sign of forced selling or fear that would mark a bottom? First off, algos don’t have feelings, and secondly, with FOMC and Big Tech earnings both occurring Wednesday, count me skeptical that we won’t see another whipsaw in the other direction before the week is over. The waters are choppy, so grab your doggy bag and hold onto the deck rail. Before we hop into a discussion of SPX, QQQ, the VIX, and earnings, here’s the link to today’s YouTube video, which you can watch by clicking here.

Glancing at the VIX above, we see the daily Keltners were respected, with 22.51 marking the high of the day, not far from the 17-22 range we mentioned last night that we would be watching today. The VIX is now almost back to the middle Keltner channel, still above the Hull moving average. One of my rules personally is to give the benefit of the doubt to whichever side of the Hull we’re on. As long as we’re above the Hull, my bias will be toward the long side for whatever instrument I’m viewing, though any indicator I use is always secondary to considerations regarding gamma (GEX) positioning.
Accompanying this gap up and crushing back down of the VIX was a big gap down of SPX, followed by price levitation back above 6,000. This move can also be viewed as a test of the middle Keltner channel, and a trip back up toward the Hull, which hasn’t yet been reached.
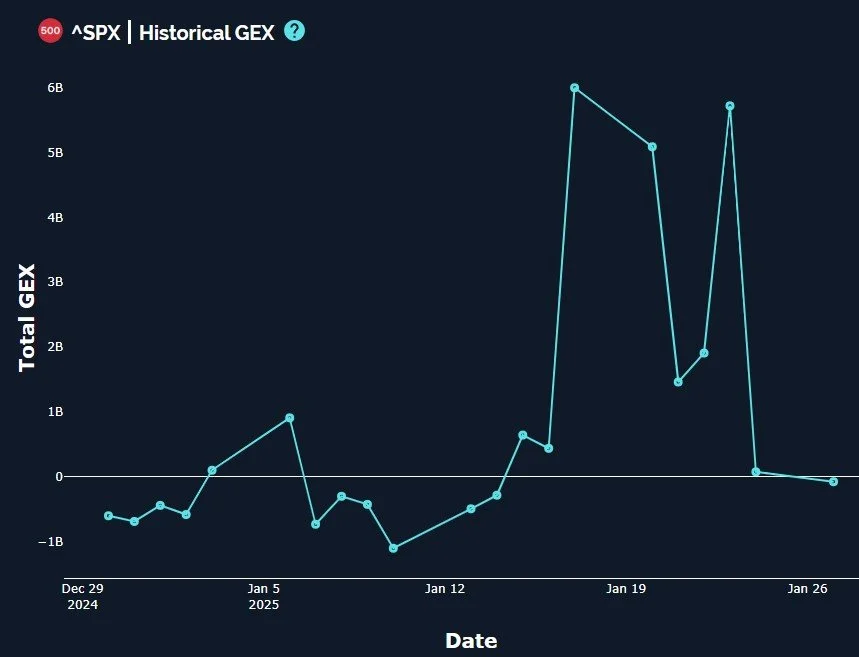
A bullish divergence (or at least the absence of a bearish change) may exist in the fact that SPX’s GEX didn’t decline much at all today, it stayed fairly stable near the zero line. Certainly far from being a bearish indication, and more in line with the idea that earnings and FOMC can completely change course (or accelerate the downside?) for a market that will otherwise be awaiting more information (catalyst) before the next move.
At one point today, SPX’s G2 Dealer Cluster zone was 5700-5800, though by the close, that zone was just above 5900 up to the 6000 area. One noticeable development is the upper zone which moved higher, now reflecting 6300-6400, a potentially bullish observation.

QQQ looks a lot less bullish than SPX, breaching not just the Hull but also the middle Keltner channel, almost halfway to the lower Keltner. While QQQ may generally follow SPX higher in the coming days, the divergence may justify caution with an eye toward 497-500 in the event QQQ continues lower.

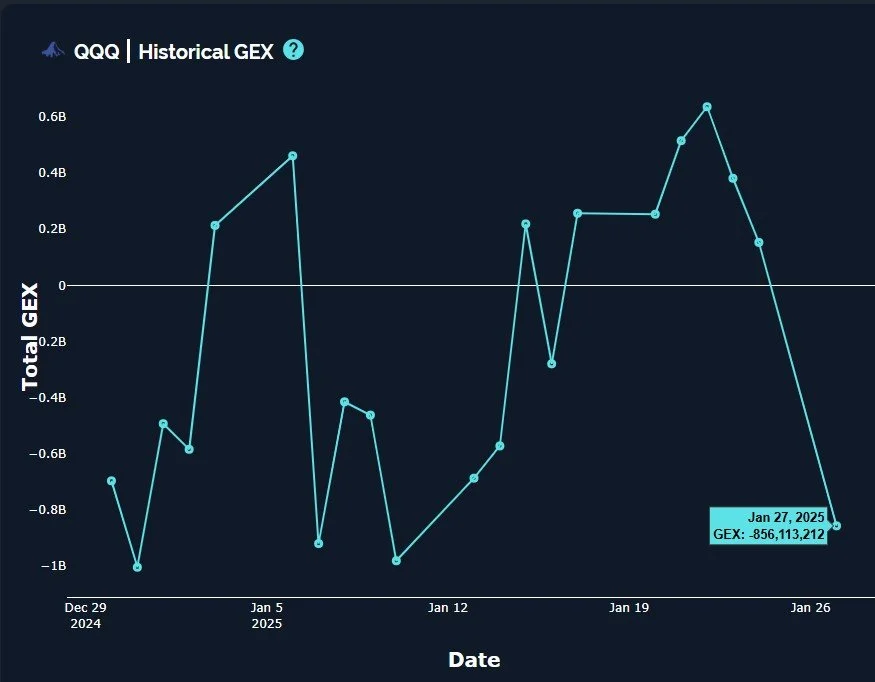
QQQ’s GEX dove a lot lower, in contrast to SPX, reaching -856M. One note of caution regarding QQQ is that you can see recent GEX highs and lows actually accompanied price highs and lows in a correlated fashion at the extremes. Does that mean today’s GEX low is also the low for QQQ’s price? We’re not saying that exactly, and in fact GEX and price may continue lower in the short term, but I also wouldn’t wait to start getting long when QQQ is back at 500M either. In other words, going long at a negative GEX extreme may work well depending on one’s timeframe, we will be watching for this potential condition in conjunction with other indicators.
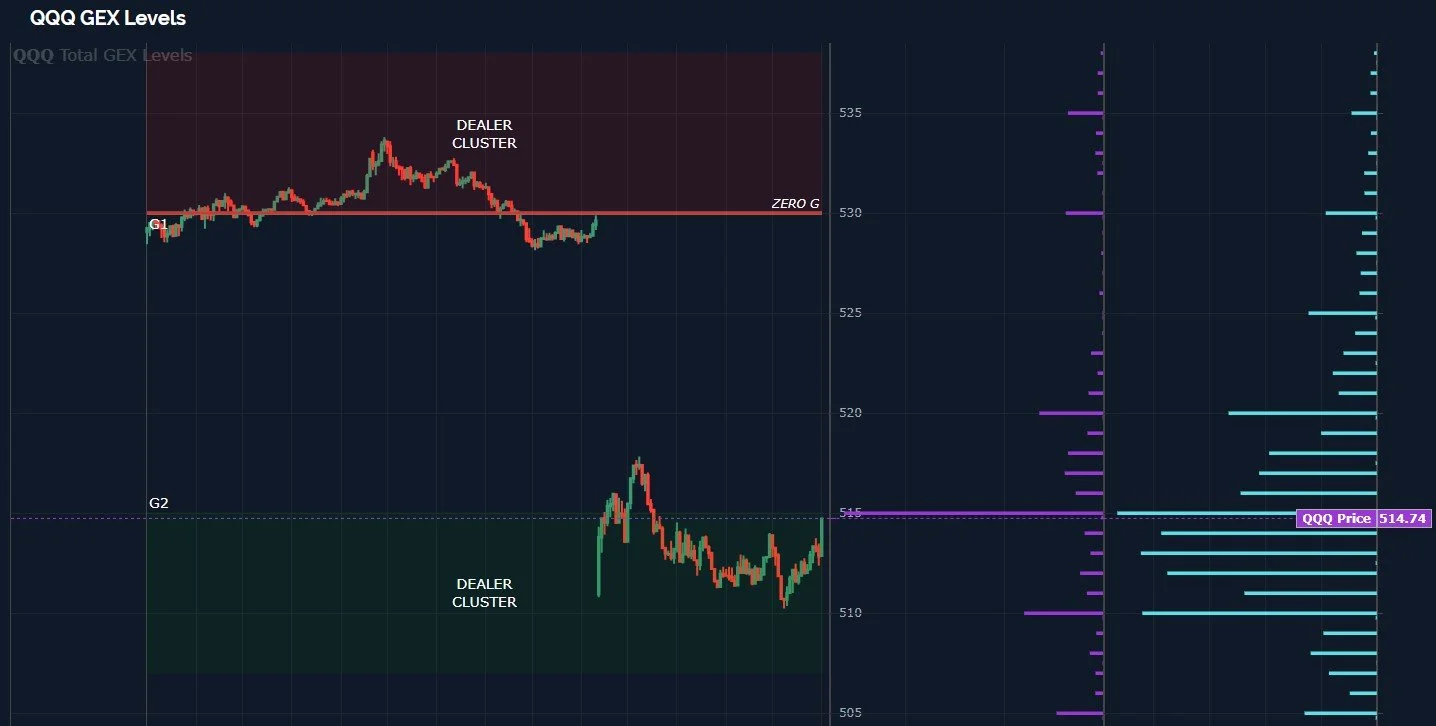
Speaking of other indicators/quantitative observations, QQQ is currently within the G2 Dealer Cluster zone, encompassing the 507 area up to 515. We may not reach 500 if this zone holds, but I won’t be surprised if we do overshoot to the downside. If we see more selling, we’ll want to see if this zone remains static or shifts lower as well.
Tomorrow sees some big defense sector names and other well-known brands report earnings, but it’s really Wednesday that may begin the next big move for markets, with FOMC in the afternoon and META, TSLA, and MSFT after hours. Things are about to heat up further in markets as the week progresses, so we hope you’ll join us in Discord tomorrow and Wednesday!

Here’s the Discord link if you haven’t joined us yet. Access is free for some channels, and new members have a 7-day trial to see how we operate.
If you’re interested in accessing our tools and analytics, be sure to check out our website. We just rolled out 500 new tickers and speed enhancements!
If you’re interested in learning more about our strategy and approach, we address all of these topics in our Geek University course which is included in all memberships.
We recently posted a YouTube video, and we have many other short videos, so give our channel a look if you’re curious about recent market commentary and ideas as well as gamma (GEX) concepts explained.
Thanks for being part of our community and know that we invite your feedback!
The information provided by Geeks of Finance LLC is for educational purposes only and is not intended to be, nor should be construed as, an offer, recommendation or solicitation to buy or sell any security or instrument or to participate in any transaction or activity. Please view our Investment Adviser Disclaimer and Risk Disclosure.