
A Pivotal (shortened) Week
We maintained an upward bias last week, especially given that it was monthly OpEx week following a steady downtrend, leaving a lot of put option premium to kill, a logical outcome, though admittedly one of many outcomes that could have happened. Gamma (GEX) led us in the right direction by advertising large GEX clusters set to expire friday at the 6000-6050 area by mid-week, narrowing down to 6000 as we progressed into the second half of the week.
If we zoom out, we are still within a big picture uptrend, and that uptrend won’t be in danger without some major levels being broken below. That said, and just as we mention in today’s YouTube video (which you can view by clicking here), we wouldn’t be surprised to see some consolidation this week and even potentially modest downside. We still have the burden of proof on the bulls short term despite breaking the downtrend line. Seemingly contradictory statements of bullishness and bearishness on the surface make more sense once taken in the context of timeframe: It’s entirely possible to be skeptical of entering a new bear market based on long term trends while ackowledging that weakness has an edge in the short term. Let’s dig into this a bit more:

Let’s start with a quick look at the chart above, showing ES futures, since markets were closed today due to the MLK holiday in the USA. We see the weekly Hull moving average at 6054.87 providing resistance at the moment. A common theme you’ll notice: Look back and glance at what happens with a daily close below the Hull, or a daily close above the Hull. Closing above tends to act as a propellant higher in general, and a close below tends to send us lower, though the magnitude certainly varies.
Friday’s SPX chart (below) shows similar rejection at the Hull. Price may end up above the Hull and hold the gain tomorrow, so I am not predicting what comes next, only that I will not lean long until I see price above that line and holding that line for a day, or a major shift in the GEX picture early this week (the best indication would be to see both of those changes together).

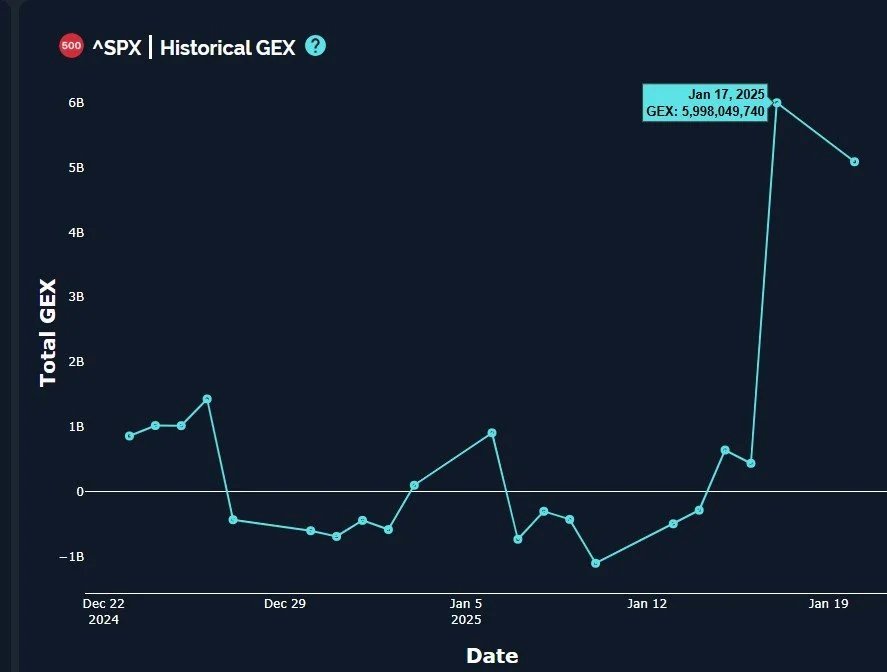
I can’t remember the last time we saw GEX for SPX at almost 6B, a huge number, and our GEX Intensity Gauge (not shown here) confirms that Friday’s reading was at an extreme relative to the past 52 weeks of GEX readings. We’ve historically viewed GEX above 1B as bullish, but reaching relative extremes can be a recipe for reversal. It’s hard to pass too much judgment either way with the reading occuring at the close of a major OpEx Friday, the first one of the year. Let’s see how participants position early this week following Friday’s reset.
We have a similar story for QQQ in terms of needing to see how GEX shifts tomorrow, following Friday’s OpEx, but for now let’s look at NQ futures for the same reason we took a glance at ES futures. The weekly Keltner channels still lean slightly bullish, but the weekly Hull sits overhead as resistance. Look at how close we came to the line tonight: NQ’s high was 21,778.75, the Hull is 21,780.95, barely a 2-point difference.

We need to take a quick look at the VIX given that the VIX monthly options expire Wednesday the 22nd premarket, which will signal a potential GEX shift for the VIX, similar to the broader markets OpEx week last week. The VIX seems to respect the weekly Hull similar to other indices, and I’ve circled a few times in recent past where the VIX crossed under or above the Hull and closed in the direction of that change. The most modest change appears to be back in June 2024 when the VIX closed above the line and barely spiked higher for a day before closing in the red, but most of the other changes marked the beginning of significant moves for the VIX either up or down. We are right on that line now, also at the lower 4-hour Keltner channel, a more narrow subset of data points over the last 6 months that has not seen the VIX sustain more than 3 days below the lower Keltner channel. The past never predicts the future, but I also prefer to not challenge recent evidence of consistency by telling myself “this time is different.” Maybe it is, but can you calculate the odds? Recent odds suggest the VIX will have a hard time sustaining lower prices in the near term unless we are truly seeing a major change in market behavior.

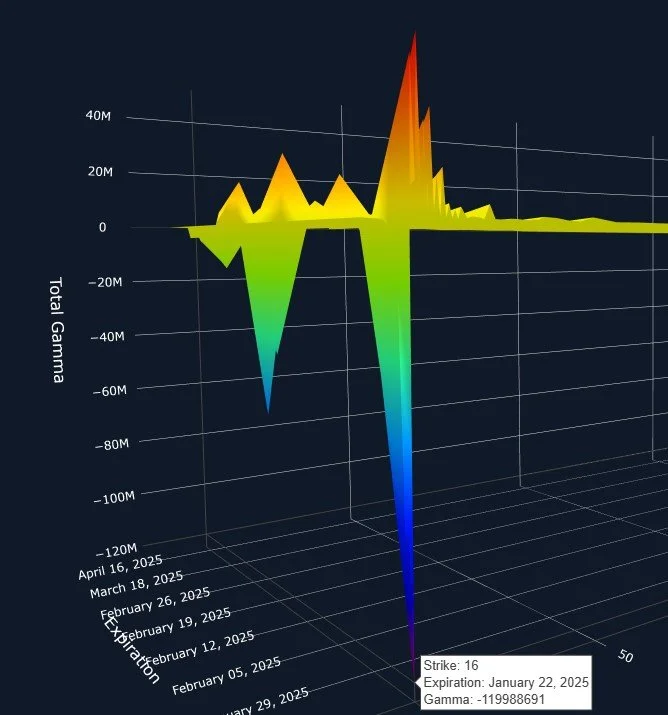
The GEX picture isn’t really helping volatility bears either, with a lot of negative GEX disappearing that we saw last week and the VIX sitting right in a Dealer Cluster zone in the 15-16 range. Volume Friday was mostly at VIX 18 and 19, roughly 10-15% higher.

I mentioned the large negative GEX at the 15 strike disappearing (or rather moving to February), which is noteworthy because 15 was the largest GEX cluster at times last week for this week’s expiration. 16 has replaced 15 as the most represented GEX cluster on the negative side, and we have seen some increase in higher VIX strikes. It’s possible we see some volatility leading up to or right after Wednesday’s expiration, so be aware of where the VIX is sitting and the lower odds that the VIX holds far below that largest GEX cluster at 16.
We’ll tackle tomorrow’s intraday trading opportunities in our Discord , so we hope you’ll join us there as we take a fresh look at the early indications for GEX positioning!
If you’re interested in accessing our tools and analytics, be sure to check out our website. We just rolled out 500 new tickers and speed enhancements!
If you’re interested in learning more about our strategy and approach, we address all of these topics in our Geek University course which is included in all memberships.
We recently posted a YouTube video, and we have many other short videos, so give our channel a look if you’re curious about recent market commentary and ideas as well as gamma (GEX) concepts explained.
Thanks for being part of our community and know that we invite your feedback!
The information provided by Geeks of Finance LLC is for educational purposes only and is not intended to be, nor should be construed as, an offer, recommendation or solicitation to buy or sell any security or instrument or to participate in any transaction or activity. Please view our Investment Adviser Disclaimer and Risk Disclosure.