
Put Options Incinerated!
Our early jokes were only half jokes, looks like Mr. Griffin (Citadel) certainly led bears to the slaughter for OpEx week. As we enter the back half of the week, we want to stay nimble, as we have uncertainty heading into Friday, despite today’s bullish overtaking of resistance levels. Will we see continuation and a high point Friday, or will the rally fail before the week is over? We don’t know, but we can look at the charts and gamma (GEX) to develop a set of levels we’ll be watching and applying toward our next moves.
We cover several important technical factors regarding SPY in today’s YouTube video, also discussing TSLA, USO, the VIX, and more, so check it out by clicking here.
The reasons for today’s rally are being stated as the CPI report and possibly bank earnings, but I personally believe a reason is always found after the fact to justify moves whether or not the stated reason is the actual reason..And we noted several factors that had us at least leaning toward the positive side, and we mentioned this in the newsletter as well as YouTube. These factors include yesterday’s positive divergence shown by DIA, the VIX reaching the upper Keltner channel, SPY and SPX sitting in a lower Dealer Cluster zone, and the fact that we were entering OpEx week after a sustained period of downside action, leaving lots of bearish premium to kill (admittedly OpEx is the most speculative and least quantitative reason). CPI was unkown, but we had plenty of known factors to reference.
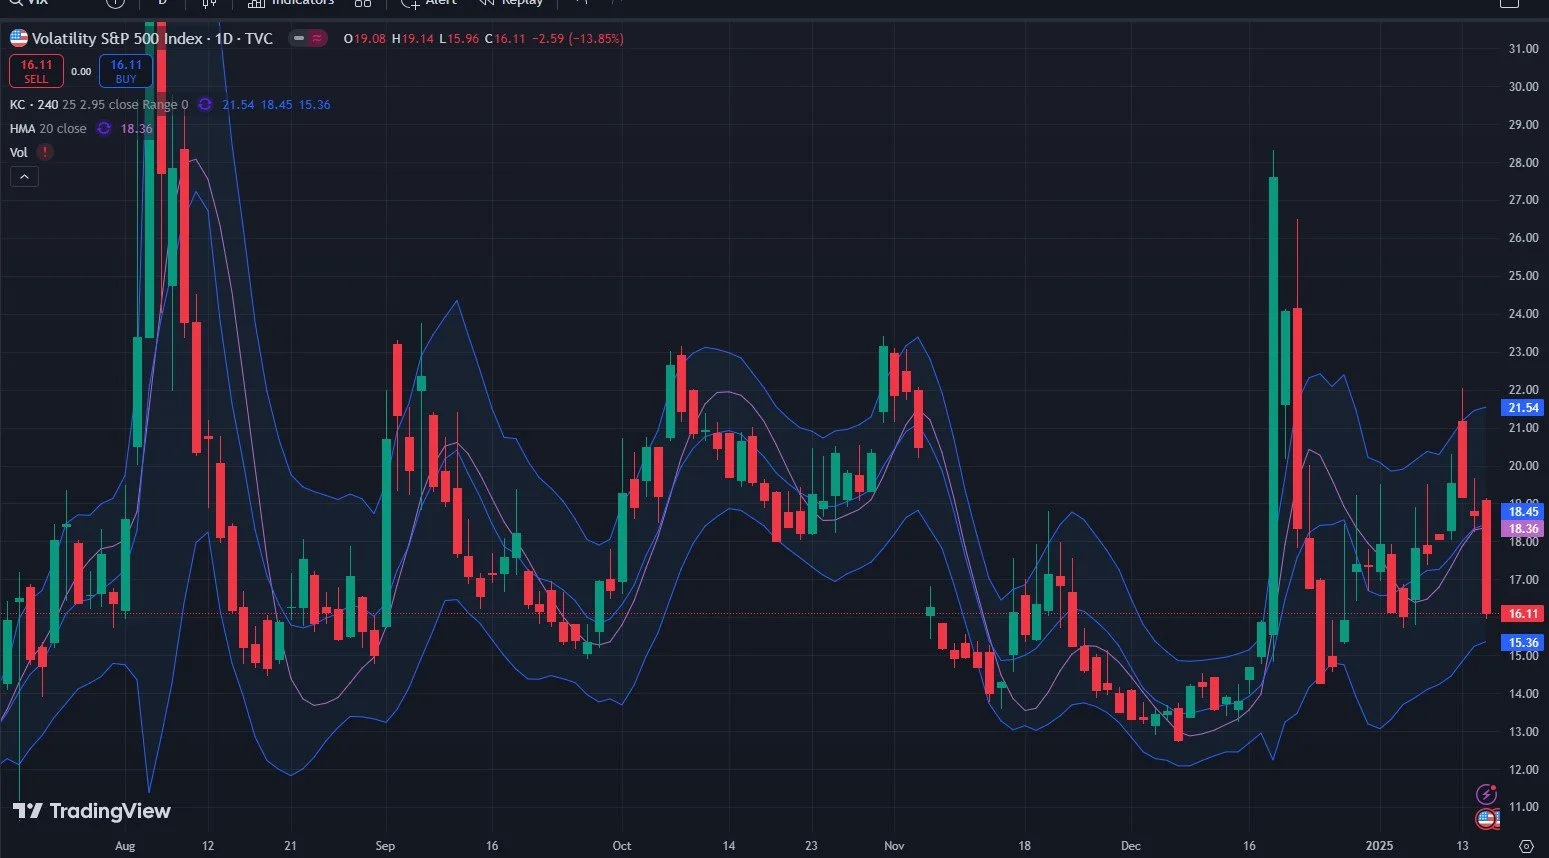
Let’s start by looking at the VIX, which has plummeted since reaching 22 Monday. I chose the 4-hour Keltner settings because we have already overshot the 2-hour chart to the downside, and the next level I’ll be watching is roughly VIX 15. While it’s too early to say whether or not we rally for an extended period odf time, I think the VIX has good odds to hold that area based on the 4-hour Keltners looking bullish for volatility, VIX expiration on January 22 showing a large amount of negative GEX at 15 and 16, and the importance of 15 over the last year or so. A break below the 4-hour channel that holds may open the door to much lower levels for the VIX, so we know what we’ll be watching.
In Discord today, I posted a noteworthy shift in SPX’s 3D GEX graph, which of course moved more positive today, but we also saw 6050 emerge as the largest positive cluster for Friday’s expiry. Noteworth negative clusters exist at 5900 and 5950 as well, but overall net GEX has shifted to positive territory as of today’s close. Will 6050 be the approximate upside target for this move? I’m not sure, but I’ll be watching what happens at 6050 if upside momentum (or an overnight gap up, if you want to call that momentum) continues.

SPX stopped right below the middle Keltner channel on the daily, and in my view, the chart still isn’t looking very bullish. The Keltner’s are in a downtrend and price is also holding the downtrend so far. My personal opinion (not that you asked) is that even if we do continue lower, at some point it becomes too easy to perfectly turn at the channel boundaries, so I’m prepared for an OpEx “shake ‘n bake” that sees the downtrend line broken to the upside, just to make more bears cry uncle before heading back toward the lower channel levels. GEX lends at least some credibility to this speculative idea, but I certainly wouldn’t blindly act upon any ideas happening inside the recesses of my cranial cavity.

The bulls do have a couple of positives working in their favor given the upside progress, such as the fact that we are now above the Hull moving average, and any downside attempt will have to reckon with prior resistance now turned support. The Hull tells me the bias and odds may be tilted higher unless 5861 is lost. Seems pretty far below us, so I tighten up my own risk for existing longs with a stop higher than the Hull, but to each their own.
Looking at the GEX Levels chart below, we are also now in a G1 upper Dealer Cluster, where dealers may become sellers. This box does extend quite a bit higher, nearly reaching 6050 we saw intraday on the 3D graph. Noteworthy volume can be seen at 6000 today.

QQQ actually still has a little room overhead to reach its middle Keltner, with 520 being the Keltner target. If SPX moves up, QQQ could easily reach and even exceed that middle channel.

QQQ is also in a Dealer Cluster zone, which extends up toward 525. The summary of the current GEX positions for SPX and QQQ is that they’ve moved more positively as we’ve overcome key resistance areas, but there’s more work to do, and both indices sit at the lower edge of a zone where a reversal back down could occur. The lower cluster worked well, will the upper cluster now work just as well?

Join us in Discord for some GEX updates shared in real-time as well as engaging with our talented and experienced subscribers, who are more than willing to share their ideas and experiences.
If you’re interested in accessing our tools and analytics, be sure to check out our website. We just rolled out 500 new tickers and speed enhancements!
If you’re interested in learning more about our strategy and approach, we address all of these topics in our Geek University course which is included in all memberships.
We recently posted a YouTube video, and we have many other short videos, so give our channel a look if you’re curious about recent market commentary and ideas as well as gamma (GEX) concepts explained.
Thanks for being part of our community and know that we invite your feedback!
The information provided by Geeks of Finance LLC is for educational purposes only and is not intended to be, nor should be construed as, an offer, recommendation or solicitation to buy or sell any security or instrument or to participate in any transaction or activity. Please view our Investment Adviser Disclaimer and Risk Disclosure.